PROTECTED SOURCE SCRIPT
CPR+PIVOT+HL+EMA_ by Jit's
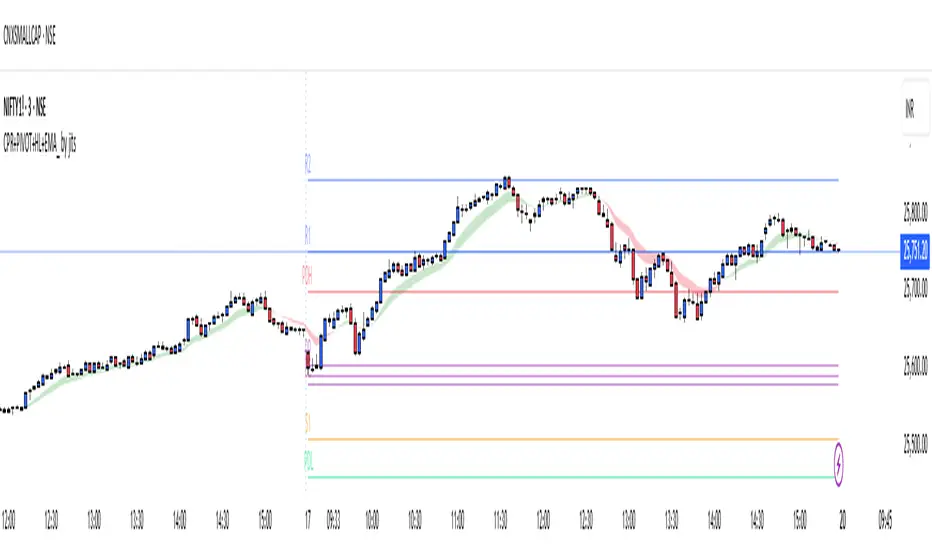
The **CPR+PIVOT+HL+EMA_ by Jit's** is a custom Trading View indicator designed especially for **index intraday trading** (like NIFTY, BANKNIFTY, and FINNIFTY). It integrates four powerful analytical components—Central Pivot Range (CPR), Pivot Points, Previous Day High/Low, and 9/15 Exponential Moving Averages (EMA)—to provide traders a comprehensive market structure and trend confirmation tool.
Core Components
**1. Central Pivot Range (CPR)**
The CPR forms the central structure of this indicator. It is derived from the previous day’s **high, low, and close** values:
- Pivot (P) = (H + L + C) / 3
- Bottom Central (BC) = (H + L) / 2
- Top Central (TC) = (P - BC) + P
These three levels together represent the market’s “value area.”
A **narrow CPR** suggests a potential trending day ahead, while a **wide CPR** indicates likely consolidation.
**2. Pivot Points & Support/Resistance Levels**
The indicator extends beyond CPR by adding **traditional or Fibonacci pivots**, dynamically plotting resistance (R1–R5) and support (S1–S5) zones. These levels assist in spotting breakout levels and intraday reversal zones.
**3. Previous Day High and Low (PDH/PDL)**
These levels are essential for understanding market context. When price stays **above PDH**, it often signals strong bullish momentum; breaking **below PDL** indicates bearish pressure. Many traders use PDH/PDL along with CPR as key validation points for entries or exits.
**4. EMA (9 and 15 periods)**
The moving averages provide short-term trend confirmation.
- **EMA(9)** captures immediate momentum.
- **EMA(15)** represents short-term trend alignment.
A crossover of EMA(9) above EMA(15) usually supports a **buy signal**, while the opposite indicates a sell bias.
Use Case in Index Trading
This indicator setup is highly suited for **index-based intraday trading** because:
- CPR gives a bias for the day (bullish/bearish).
- PDH/PDL exhibit clear breakout or reversal areas.
- EMAs refine timing for entry/exit.
- Pivot levels mark precise target and stop zones.
受保护脚本
此脚本以闭源形式发布。 但是,您可以自由使用,没有任何限制 — 了解更多信息这里。
免责声明
这些信息和出版物并非旨在提供,也不构成TradingView提供或认可的任何形式的财务、投资、交易或其他类型的建议或推荐。请阅读使用条款了解更多信息。
免责声明
这些信息和出版物并非旨在提供,也不构成TradingView提供或认可的任何形式的财务、投资、交易或其他类型的建议或推荐。请阅读使用条款了解更多信息。