OPEN-SOURCE SCRIPT
Catnobi Neon Theme
Catnobi Neon Theme 80 — A Purely Visual Candle-Glow Overlay (Open-Source)
What the script does
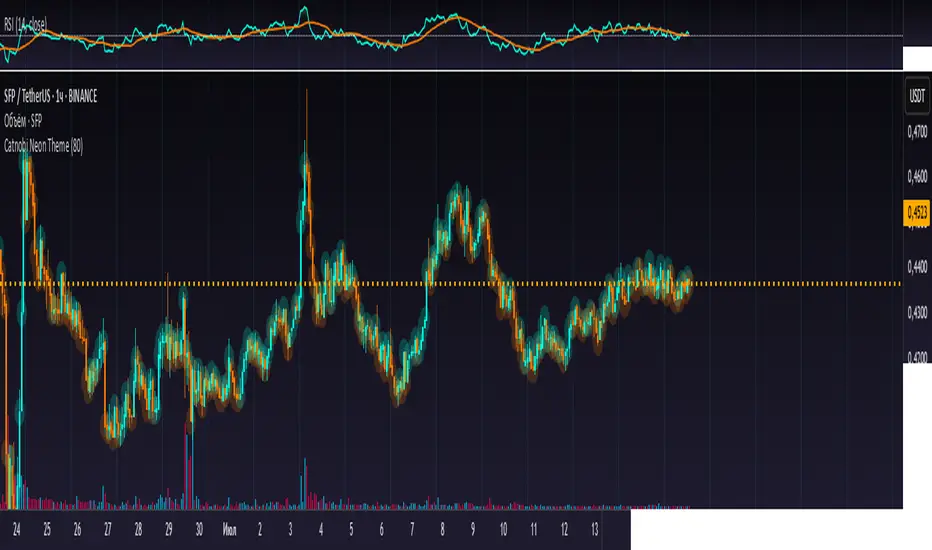
Catnobi Neon Theme 80 swaps the regular candle view for a vivid neon-glow style:
Candles (body + wicks) show up in bright turquoise when the bar closes up and in bright amber when it closes down.
Glow halo A soft, semi-transparent outline surrounds every candle, giving the impression of neon light.
Volume histogram Bars use the same palette as the candles so the entire chart keeps a consistent, cyber-punk colour scheme.
The script contains no trading signals, alerts, or calculations—it is purely decorative.
How it works (high-level)
Dual plot() technique – Each candle is drawn twice:
an enlarged, low-opacity outline creates the halo;
a second, normal-width layer renders the actual candle.
plotcandle() core – Price is still displayed with Pine’s built-in candle plotting, so the visual effect never distorts OHLC values.
Volume overlay – A simple plot() of volume with the same colour map keeps chart styling unified.
Because only basic Pine primitives are used, the script is light on resources and responsive even on lower-end machines.
Inputs / Settings
Input name Purpose Range / type Default
Theme Pick one of five curated colour sets 1 – 5 3
Glow width Thickness of the halo line (pixels) 1 – 10 4 px
Glow opacity Halo transparency 0 – 100 % 70 %
Hide volume Toggle neon volume bars true/false false
All colours are defined in HSL space, so you can easily tweak hues without losing contrast.
How to use it
Switch to a dark chart background – The glow effect is optimised for dark hex #0e0e0e, but any dark theme works.
Add Catnobi Neon Theme 80 as an overlay indicator.
(Optional) Hide the native candles via Chart settings ▸ Symbol ▸ Bar color opacity = 0 %.
Experiment with Theme, Glow width, and Glow opacity until the style matches your preference.
Why it qualifies for publication
Open-source – Code is fully visible, so the script does not fall under the “closed-source needs unique logic” rule.
Originality is visual, not trading – There are many indicator strategies, but very few lightweight, purely aesthetic glow overlays that rely solely on stock Pine functions.
Clear description – Users know exactly what to expect (no hidden buy/sell logic) and how the glow is generated.
MIT License
This script is released under the MIT licence. Feel free to fork, adapt, or redistribute—just keep the original author attribution somewhere in your code header.
The script is intended for traders who enjoy a cyber-punk vibe on their charts without compromising clarity or performance. Happy glowing!
What the script does
Catnobi Neon Theme 80 swaps the regular candle view for a vivid neon-glow style:
Candles (body + wicks) show up in bright turquoise when the bar closes up and in bright amber when it closes down.
Glow halo A soft, semi-transparent outline surrounds every candle, giving the impression of neon light.
Volume histogram Bars use the same palette as the candles so the entire chart keeps a consistent, cyber-punk colour scheme.
The script contains no trading signals, alerts, or calculations—it is purely decorative.
How it works (high-level)
Dual plot() technique – Each candle is drawn twice:
an enlarged, low-opacity outline creates the halo;
a second, normal-width layer renders the actual candle.
plotcandle() core – Price is still displayed with Pine’s built-in candle plotting, so the visual effect never distorts OHLC values.
Volume overlay – A simple plot() of volume with the same colour map keeps chart styling unified.
Because only basic Pine primitives are used, the script is light on resources and responsive even on lower-end machines.
Inputs / Settings
Input name Purpose Range / type Default
Theme Pick one of five curated colour sets 1 – 5 3
Glow width Thickness of the halo line (pixels) 1 – 10 4 px
Glow opacity Halo transparency 0 – 100 % 70 %
Hide volume Toggle neon volume bars true/false false
All colours are defined in HSL space, so you can easily tweak hues without losing contrast.
How to use it
Switch to a dark chart background – The glow effect is optimised for dark hex #0e0e0e, but any dark theme works.
Add Catnobi Neon Theme 80 as an overlay indicator.
(Optional) Hide the native candles via Chart settings ▸ Symbol ▸ Bar color opacity = 0 %.
Experiment with Theme, Glow width, and Glow opacity until the style matches your preference.
Why it qualifies for publication
Open-source – Code is fully visible, so the script does not fall under the “closed-source needs unique logic” rule.
Originality is visual, not trading – There are many indicator strategies, but very few lightweight, purely aesthetic glow overlays that rely solely on stock Pine functions.
Clear description – Users know exactly what to expect (no hidden buy/sell logic) and how the glow is generated.
MIT License
This script is released under the MIT licence. Feel free to fork, adapt, or redistribute—just keep the original author attribution somewhere in your code header.
The script is intended for traders who enjoy a cyber-punk vibe on their charts without compromising clarity or performance. Happy glowing!
开源脚本
秉承TradingView的精神,该脚本的作者将其开源,以便交易者可以查看和验证其功能。向作者致敬!您可以免费使用该脚本,但请记住,重新发布代码须遵守我们的网站规则。
免责声明
这些信息和出版物并非旨在提供,也不构成TradingView提供或认可的任何形式的财务、投资、交易或其他类型的建议或推荐。请阅读使用条款了解更多信息。
开源脚本
秉承TradingView的精神,该脚本的作者将其开源,以便交易者可以查看和验证其功能。向作者致敬!您可以免费使用该脚本,但请记住,重新发布代码须遵守我们的网站规则。
免责声明
这些信息和出版物并非旨在提供,也不构成TradingView提供或认可的任何形式的财务、投资、交易或其他类型的建议或推荐。请阅读使用条款了解更多信息。