PROTECTED SOURCE SCRIPT
已更新 Pixiu AI - Support and Resistance
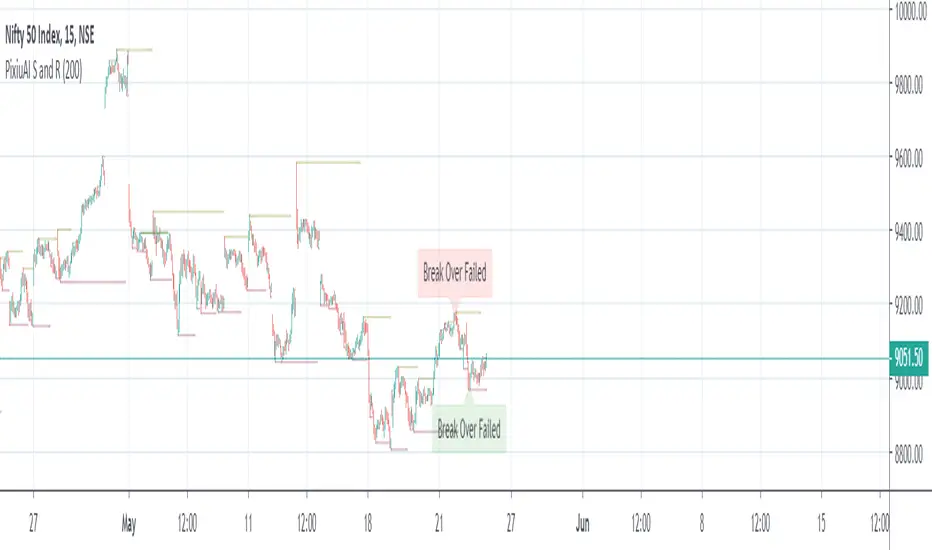
Support and Resistance prices are the previous points of highs and lows in the price. The market tends to stick around in price regions and directional trends. Using these price points one can wait and take the following decisions:
- when the price reaches the support point, they can take a long position if they observe the price staying in the price range and make profits from till it gains back up to the resistance point. (and vice-versa)
- when the price breaks the support/resistance (S&R) points and continues in that direction in addition to high volumes supporting it, people can take a bullish trade
- when the price breaks the S&R point, traders can wait for the price to return to the S&R point to make a final decision of whether it wants to go up or not. A price tested strategy is considered stronger than just price breaks
We at The Pixiu want to help you in your daily trade, and therefore we present you an auto Support and Resistance indicator that also highlights the points of crossovers to the users in the live market. Use this for assistance while trading and share your feedback with us.
There are 3 parameters for the indicator:
- Short-range S&R
- Mid-range S&R
- Identify the point of S&R testing (when price crosses over and returns back in the range)
版本注释
Support and Resistance prices are the previous points of highs and lows in the price. The market tends to stick around in price regions and directional trends. Using these price points one can wait and take the following decisions:- when the price reaches the support point, they can take a long position if they observe the price staying in the price range and make profits from till it gains back up to the resistance point. (and vice-versa)
- when the price breaks the support/resistance (S&R) points and continues in that direction in addition to high volumes supporting it, people can take a bullish trade
- when the price breaks the S&R point, traders can wait for the price to return to the S&R point to make a final decision of whether it wants to go up or not. A price tested strategy is considered stronger than just price breaks
We at The Pixiu want to help you in your daily trade, and therefore we present you an auto Support and Resistance indicator that also highlights the points of crossovers to the users in the live market. Use this for assistance while trading and share your feedback with us.
There are 3 parameters for the indicator:
- Short-range S&R
- Mid-range S&R
- Long-range S&R with number of candle look-back option
- Identify the point of S&R testing (when price crosses over and returns back in the range)
受保护脚本
此脚本以闭源形式发布。 但是,您可以自由使用,没有任何限制 — 了解更多信息这里。
免责声明
这些信息和出版物并非旨在提供,也不构成TradingView提供或认可的任何形式的财务、投资、交易或其他类型的建议或推荐。请阅读使用条款了解更多信息。
免责声明
这些信息和出版物并非旨在提供,也不构成TradingView提供或认可的任何形式的财务、投资、交易或其他类型的建议或推荐。请阅读使用条款了解更多信息。