INVITE-ONLY SCRIPT
已更新 Blockunity Ultimatyx Oscillator (BUO)
Works with "Blockunity Ultimatyx Screener (BUS)".
The goal of this indicator is to give you an overview of the status of many indicators on different timeframes. It consists of a Screener and an Oscillator. The oscillator allows you to detect correlations between the indicators included in the Screener in order to give buy and sell points.
Usage Advice
There are no specific guidelines for this indicator. It works on all time units and all assets. We still recommend that you use your chart in logarithmic.
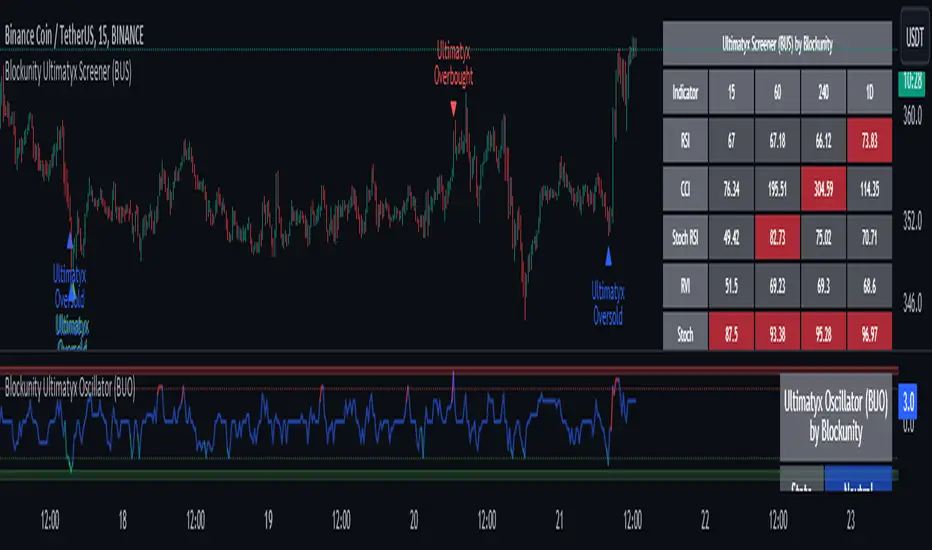
The Different Elements And Signals – The Screener
On your chart, you can find the Screener. It indicates the values of the following indicators:
The background of each cell changes color if the indicator is oversold (green) or overbought (red).
In addition, it allows you to visualize all these values directly on several time units:
It is possible to change the time unit of the columns 1h, 4h, and Daily in the parameters. The first time unit column is dynamic and linked to the one you choose for your chart.
In addition, you will find directly on the chart the buy and sell points. By default, we display the « Ultimatyx » signals, which are a correlation of the different indicators present in the Screener. Of course, you are able to display the signals of your choice by modifying it in the « Style » tab of the indicator parameters.
The Different Elements And Signals – The Oscillator
The oscillator allows you to identify the moments of correlation between the different indicators of the Screener. Its color varies according to the number of indicators returning the same signal. These thresholds are configurable. The color code is as follows:
It's the oscillator that triggers the « Ultimatyx » signals.
The goal of this indicator is to give you an overview of the status of many indicators on different timeframes. It consists of a Screener and an Oscillator. The oscillator allows you to detect correlations between the indicators included in the Screener in order to give buy and sell points.
Usage Advice
There are no specific guidelines for this indicator. It works on all time units and all assets. We still recommend that you use your chart in logarithmic.
The Different Elements And Signals – The Screener
On your chart, you can find the Screener. It indicates the values of the following indicators:
- RSI (Relative Strength Index).
- CCI (Commodity Channel Index).
- Stoch RSI (Stochastic RSI).
- RVI (Relative Vigor Index).
- Stoch (Stochastic).
- TSI (True Strength Index).
- BB% (Bollinger Bands %B).
- %R (Williams Percent Range).
The background of each cell changes color if the indicator is oversold (green) or overbought (red).
In addition, it allows you to visualize all these values directly on several time units:
- Unit of the chart/the one you select.
- 1h.
- 4h.
- Daily.
- Weekly.
It is possible to change the time unit of the columns 1h, 4h, and Daily in the parameters. The first time unit column is dynamic and linked to the one you choose for your chart.
In addition, you will find directly on the chart the buy and sell points. By default, we display the « Ultimatyx » signals, which are a correlation of the different indicators present in the Screener. Of course, you are able to display the signals of your choice by modifying it in the « Style » tab of the indicator parameters.
The Different Elements And Signals – The Oscillator
The oscillator allows you to identify the moments of correlation between the different indicators of the Screener. Its color varies according to the number of indicators returning the same signal. These thresholds are configurable. The color code is as follows:
- Yellow: Heavily Oversold.
- Green: Oversold.
- Purple: Neutral.
- Red: Overbuy.
- Dark pink: Heavily Overbuy.
It's the oscillator that triggers the « Ultimatyx » signals.
版本注释
- Replacement of the Rate Of Change (ROC) by the Stochastic RSI.
- Correction on the RVI and TSI plot.
- Added the following technical indicators in replacement of the SMA and EMA: Bollinger Bands % and Williams Percent Range.
- Added limits and zones on the oscillator. It is possible to disable these elements in the parameters.
版本注释
- Buy/Sell signals changed to Overbought/Oversold.
- Added a mechanism for determining volatility.
- If volatility is considered too high, signals are displayed in blue. In this case, you need to be more cautious in interpreting them, because when volatility is too high, overbought and oversold signals may be given a bit early.
- Reduced table transparency for better compatibility with White Mode.
- Change of some oscillator colors for better visualization in both modes (Dark & White).
版本注释
- New data table design. Moreover, it is now fully configurable.
- A few other design adjustments.
版本注释
- Some parameter values are now hidden for better readability.
- Added a version number at the end of the parameters.
版本注释
- Inversion of the oscillator's buy and sell zones for improved clarity.
版本注释
Addition of an alerting system. This alert can be activated by setting the condition "Blockunity Ultimatyx Oscillator (BUO)" and selecting "Any alert() function call". The alerts sent are as follows:- Strong overbought or oversold signal.
仅限邀请脚本
只有作者授权的用户才能访问此脚本。您需要申请并获得使用许可。通常情况下,付款后即可获得许可。更多详情,请按照下方作者的说明操作,或直接联系Blockunity。
请注意,此私密、仅限邀请脚本未经脚本版主审核,是否符合网站规则尚未确定。 TradingView不建议您付费购买或使用任何脚本,除非您完全信任其作者并了解其工作原理。您也可以在我们的社区脚本找到免费的开源替代方案。
作者的说明
You can find all the information about the Ultimatyx Screener & Oscillator here: https://unyx-data.com/ultimatyx-screener-and-oscillator/
Blockunity
app.blockunity.io/
unyx-data.com/
contact@blockunity.io
app.blockunity.io/
unyx-data.com/
contact@blockunity.io
免责声明
这些信息和出版物并非旨在提供,也不构成TradingView提供或认可的任何形式的财务、投资、交易或其他类型的建议或推荐。请阅读使用条款了解更多信息。