PROTECTED SOURCE SCRIPT
Oculus Session Levels
Oculus Session Levels
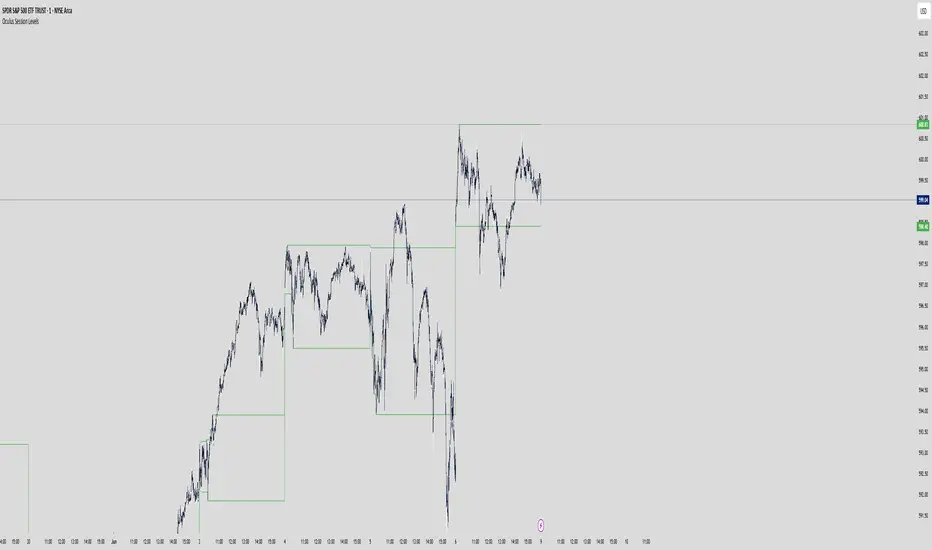
The Oculus Session Levels indicator is designed to help traders track key price levels during important market sessions: Pre-Market, Futures, and the New York Open. By marking these levels on your chart, it provides clear reference points for potential price action and breakout opportunities as the market progresses through its various phases.
Key Features:
Pre-Market High & Low: The indicator calculates and displays the highest and lowest prices during the pre-market session (from 4:00 AM to 9:30 AM EST). These levels are important for gauging potential support or resistance when the market opens.
Futures First Hour High & Low: It tracks the first hour of futures trading (from 6:00 PM to 7:00 PM EST), marking the high and low levels that can serve as important reference points for the following trading day.
New York Open High & Low: The indicator also tracks the high and low during the first hour of the New York market open (from 9:30 AM to 10:30 AM EST), providing critical levels that traders use to identify trends or reversals in the early stages of the trading day.
How to Use:
Pre-Market High & Low:
These levels are calculated before the regular market opens. Price movements near these levels after the market opens may indicate potential breakout or reversal zones.
Futures High & Low:
These levels track the overnight futures session. The price range within this session can provide insight into how the market might behave during regular trading hours.
NY Open High & Low:
The first hour of the New York session is critical for establishing market direction. Prices near these levels can signify the start of a strong trend or possible pullback.
Visual Representation:
Pre-Market High & Low: Plotted in blue.
Futures High & Low: Plotted in orange.
NY Open High & Low: Plotted in green.
These levels are updated daily, providing fresh insights based on the latest market data. The Oculus Session Levels indicator gives traders a simple but powerful tool for understanding market context and planning their trades more effectively.
受保护脚本
此脚本以闭源形式发布。 但是,您可以自由使用,没有任何限制 — 了解更多信息这里。
免责声明
这些信息和出版物并非旨在提供,也不构成TradingView提供或认可的任何形式的财务、投资、交易或其他类型的建议或推荐。请阅读使用条款了解更多信息。
受保护脚本
此脚本以闭源形式发布。 但是,您可以自由使用,没有任何限制 — 了解更多信息这里。
免责声明
这些信息和出版物并非旨在提供,也不构成TradingView提供或认可的任何形式的财务、投资、交易或其他类型的建议或推荐。请阅读使用条款了解更多信息。