OPEN-SOURCE SCRIPT
Kumo Implied Volatility
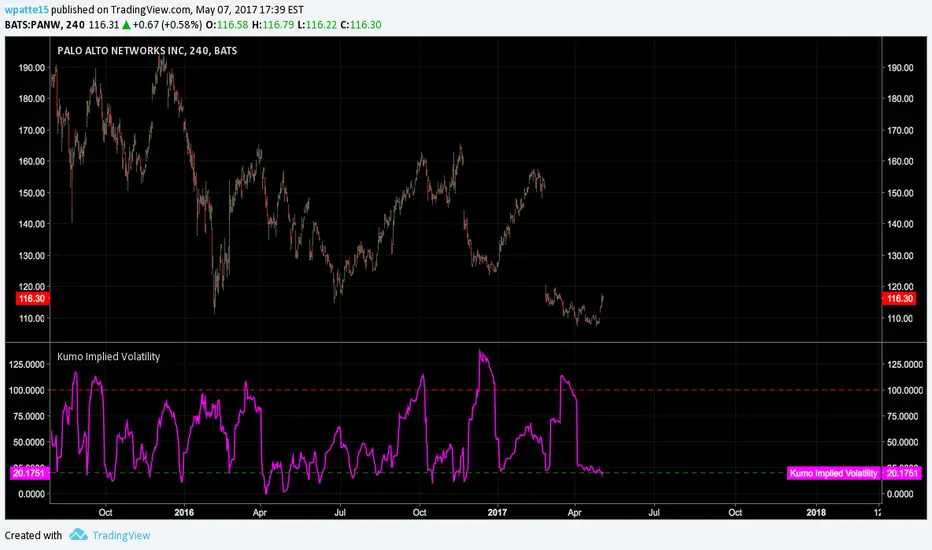
From ProRealCode prorealcode.com/prorealtime-indicators/kumo-implied-volatility/:
"In my pursuit to quantify the Ichimoku indicator, I have tried to quantify implied volatility by measuring the Kumo thickness. Firstly, I took the absolute value of the distance between SpanA and SpanB, I then normalized the value and created standard deviation bands. Now I can compare the Kumo thickness with the average thickness over 200 periods. When the value goes above 100, it implies that the Kumo is thicker than 2 standard deviations of the average (there is therefore only a 5% chance that this happens). A reading over 100 might indicate trend exhaustion and a reading below 20 indicates low volatility and Kumo twists (I chose 20 only by observation and not statistical significance). Interestingly, this indicator sometime gives similar information to ADX. So far, the best use for this indicator is as a setup indicator for trend exhaustion or low volatility breakouts from Kumo twists. Extreme readings before Kumo breakouts looks interesting."
"In my pursuit to quantify the Ichimoku indicator, I have tried to quantify implied volatility by measuring the Kumo thickness. Firstly, I took the absolute value of the distance between SpanA and SpanB, I then normalized the value and created standard deviation bands. Now I can compare the Kumo thickness with the average thickness over 200 periods. When the value goes above 100, it implies that the Kumo is thicker than 2 standard deviations of the average (there is therefore only a 5% chance that this happens). A reading over 100 might indicate trend exhaustion and a reading below 20 indicates low volatility and Kumo twists (I chose 20 only by observation and not statistical significance). Interestingly, this indicator sometime gives similar information to ADX. So far, the best use for this indicator is as a setup indicator for trend exhaustion or low volatility breakouts from Kumo twists. Extreme readings before Kumo breakouts looks interesting."
开源脚本
秉承TradingView的精神,该脚本的作者将其开源,以便交易者可以查看和验证其功能。向作者致敬!您可以免费使用该脚本,但请记住,重新发布代码须遵守我们的网站规则。
免责声明
这些信息和出版物并非旨在提供,也不构成TradingView提供或认可的任何形式的财务、投资、交易或其他类型的建议或推荐。请阅读使用条款了解更多信息。
免责声明
这些信息和出版物并非旨在提供,也不构成TradingView提供或认可的任何形式的财务、投资、交易或其他类型的建议或推荐。请阅读使用条款了解更多信息。