PROTECTED SOURCE SCRIPT
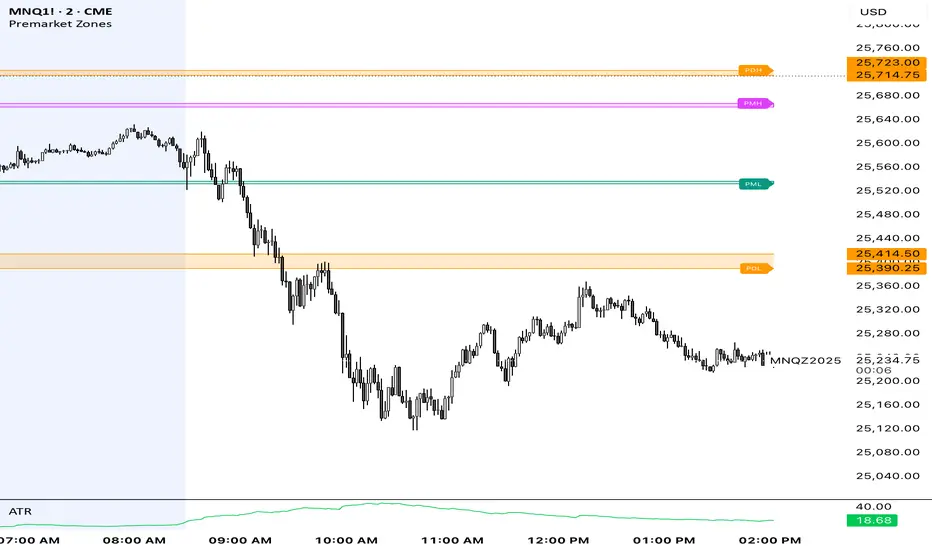
Premarket Zones
This indicator is built for index futures traders (ES, NQ, RTY, YM) who trade liquidity, session structure, and high-probability reaction levels using true CME futures timing.
It automatically plots:
Premarket High & Low zones (wick + body)
Previous Day Futures RTH High & Low zones (PDH / PDL)
Clean right-edge labels
First-touch alerts (once per day)
All calculations are based on Central Time (CT) and CME futures sessions, not equity cash-market hours.
🕒 Session Definitions (CME / Central Time)
Session Time (CT) Purpose
Premarket 03:00 – 08:30 Overnight liquidity build
Futures RTH (Calc) 08:30 – 15:00 True CME regular trading hours
Plot Window 03:00 – 16:00 Visual extension of zones
This script intentionally uses 08:30 CT as the futures open — not 09:30 equity cash open.
🔷 Premarket Zones (PMH / PML)
The indicator builds two premarket zones using multi-timeframe precision.
How they are calculated:
1-minute candles → capture the true wick extremes
5-minute candles → capture the dominant body area
Zones:
Premarket High Zone (PMH)
Between the highest 5-minute candle body and the highest 1-minute wick
Premarket Low Zone (PML)
Between the lowest 1-minute wick and the lowest 5-minute candle body
Key behavior:
Zones finalize at 08:30 CT
Once finalized, zones are drawn as boxes that extend left to 03:00 CT
Zones extend forward through the trading day for context
PMH / PML labels are plotted on the right edge
These zones represent overnight liquidity pools commonly used for:
Opening drive continuation
Liquidity sweeps
Mean reversion
Acceptance vs rejection at the open
🔶 Previous Day High / Low (PDH / PDL)
This script plots TRUE futures PDH / PDL, not equity-based levels.
How they are calculated:
Uses only the prior day’s futures RTH (08:30–15:00 CT)
1-minute candles → wick extremes
5-minute candles → body value areas
Zones:
PDH Zone: 5m body → 1m wick
PDL Zone: 1m wick → 5m body
These levels represent:
Institutional reference points
Prior session balance extremes
High-probability reaction zones
Clean PDH / PDL labels are plotted on the right edge.
🔔 Alerts (Once Per Day)
The indicator includes first-touch alerts for:
PDH
PDL
Premarket High Zone
Premarket Low Zone
Each alert triggers only once per session, making it ideal for:
Trade planning
Discipline-based execution
Prop firm risk control
📈 How Traders Use This Script
This indicator is context-based, not predictive.
Common use cases:
Waiting for liquidity sweeps into PMH / PML
Trading rejection or acceptance at PDH / PDL
Combining with:
VWAP
Opening Range
Market structure
Volume or delta tools
It works especially well on:
Opening range days
Mean-reversion conditions
Trend continuation days after overnight imbalance
🎯 Design Philosophy
Futures-first logic
No clutter
No repainting
No equity-market assumptions
Levels professionals actually use
This script is designed to mirror how professional futures traders map their charts.
⚠️ Notes
Best used on 1m or 5m charts
Designed for CME index futures
Not a standalone trading system
Always manage risk
受保护脚本
此脚本以闭源形式发布。 但是,您可以自由使用,没有任何限制 — 了解更多信息这里。
免责声明
这些信息和出版物并非旨在提供,也不构成TradingView提供或认可的任何形式的财务、投资、交易或其他类型的建议或推荐。请阅读使用条款了解更多信息。
受保护脚本
此脚本以闭源形式发布。 但是,您可以自由使用,没有任何限制 — 了解更多信息这里。
免责声明
这些信息和出版物并非旨在提供,也不构成TradingView提供或认可的任何形式的财务、投资、交易或其他类型的建议或推荐。请阅读使用条款了解更多信息。