INVITE-ONLY SCRIPT
已更新 CryptoBreakers MTF Sqz Strategy
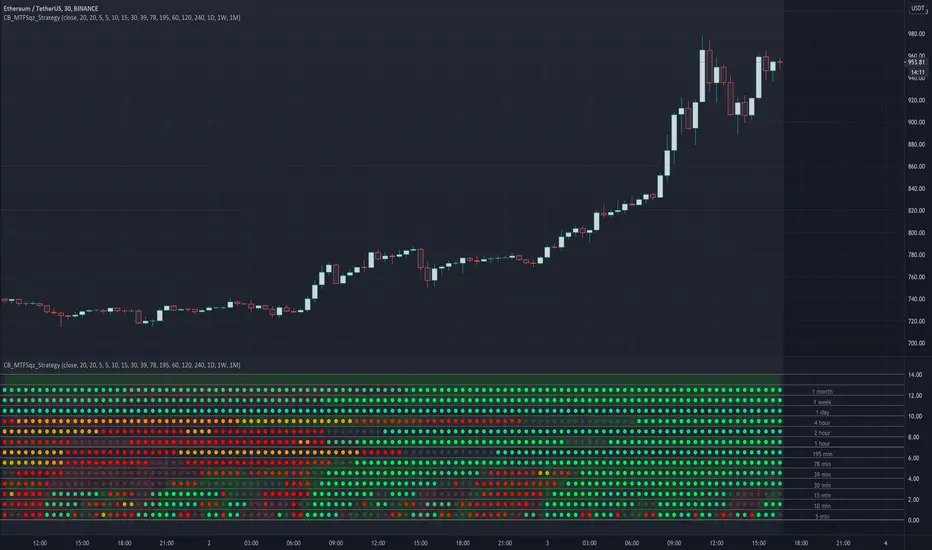
This is a Multi Time Frame squeeze strategy that has been consistently catching large BTC and ETH moves.
It's building up on the basic squeeze play of both the upper and lower Bollinger Bands going inside the Keltner Channel
and in one indicator quickly seeing when both Bollinger Bands start to come out of the Keltner channel and positioning us
for the large move that is about to take place.
Before I explain the rules for the winning strategy, let's cover the basics on the indicator.
1. When both the upper and lower Bollinger Bands go inside the Keltner Channel, a compression is in place, and the squeeze is on. This is reflected on the indicator as colored dots.
2. The indicator covers 5min, 10min, 15min, 30min, 39min, 78min, 195min, 1hr, 2hr, 4hr, 1 day, 1 week, and 1 month timeframes for squeezes.
Your chart needs to be set to the lowest time frame resolution of 5min in order for the indicator to show squeezes in all higher timeframe resolutions.
So whatever your chart resolution is, the indicator will show the squeezes in that timeframe and above correctly.
3. ORANGE dots indicate high level of compression. RED dots indicate medium level of compression. BLACK dots indicate low level of compression and the GREEN dots indicate no compression.
4. Generally, higher the level of compression and the longer duration of the squeeze, the more explosive the move expected. With this one indicator I was able to consistently catch 500 plus
point moves in BTC and 30-50 point moves in ETH.
Let's review the rules of the strategy:
1. For the ideal set up, we look for two lower timeframe resolutions (preferably 30 and 39 minutes OR 39 minutes and 78 minutes) to be in squeeze for at least 6 dots and at the sametime we
need to see one or two higher timeframe resolutions in squeeze (195 minutes and 1 day OR 1 day and 1 week resolutions)
2. Determine the direction of the trend in the higher time frames (bullish and bearish). We look for stacked up or down EMAs of 8, 21, 34, 55 and 84 on a daily and/or weekly chart.
3. For entry, wait for the lower timeframe squeeze to fire meaning look for the first green dot after the black, red, or orange dots (minimum six in total).
For example the 30 min row shows the first green dot after the sequence of squeeze dots and the direction of the price movement (up or down) at that green dot bar aligns with the direction of the price movement in the higher timeframe chart.
4. Once the lower timeframe squeezes fire, we follow the move to continuation of the firing of the higher timeframe squeezes.
5. Our exit will be at the price point of 6-9 green dots after the higher timeframe squeeze fired in the same direction as the lower timeframe.
I created this to make it easier to see the set up on any stock and crypto chart. It has been working consistently on BTC and ETH price action. I have not seen anything on TV that cover multi time frame squeeze play in a very simple and clean way.
This makes it very easy to see the set up with one indicator. I'm using this with my trading group.
If you would like to get access, please feel free to DM me at CryptoBreakers
版本注释
Updated a type in Overlay setting so the indicator actually shows. 仅限邀请脚本
只有作者授权的用户才能访问此脚本。您需要申请并获得使用许可。通常情况下,付款后即可获得许可。更多详情,请按照下方作者的说明操作,或直接联系CryptoBreakers。
TradingView不建议您付费购买或使用任何脚本,除非您完全信任其作者并了解其工作原理。您也可以在我们的社区脚本找到免费的开源替代方案。
作者的说明
E.O. Breakers
@cryptowhenlambo
linktr.ee/cryptobreakers
patreon.com/CryptoWhenLambo
@cryptowhenlambo
linktr.ee/cryptobreakers
patreon.com/CryptoWhenLambo
免责声明
这些信息和出版物并非旨在提供,也不构成TradingView提供或认可的任何形式的财务、投资、交易或其他类型的建议或推荐。请阅读使用条款了解更多信息。
仅限邀请脚本
只有作者授权的用户才能访问此脚本。您需要申请并获得使用许可。通常情况下,付款后即可获得许可。更多详情,请按照下方作者的说明操作,或直接联系CryptoBreakers。
TradingView不建议您付费购买或使用任何脚本,除非您完全信任其作者并了解其工作原理。您也可以在我们的社区脚本找到免费的开源替代方案。
作者的说明
E.O. Breakers
@cryptowhenlambo
linktr.ee/cryptobreakers
patreon.com/CryptoWhenLambo
@cryptowhenlambo
linktr.ee/cryptobreakers
patreon.com/CryptoWhenLambo
免责声明
这些信息和出版物并非旨在提供,也不构成TradingView提供或认可的任何形式的财务、投资、交易或其他类型的建议或推荐。请阅读使用条款了解更多信息。