OPEN-SOURCE SCRIPT
已更新 Squeeze Momentum Signal Overlay [GN]
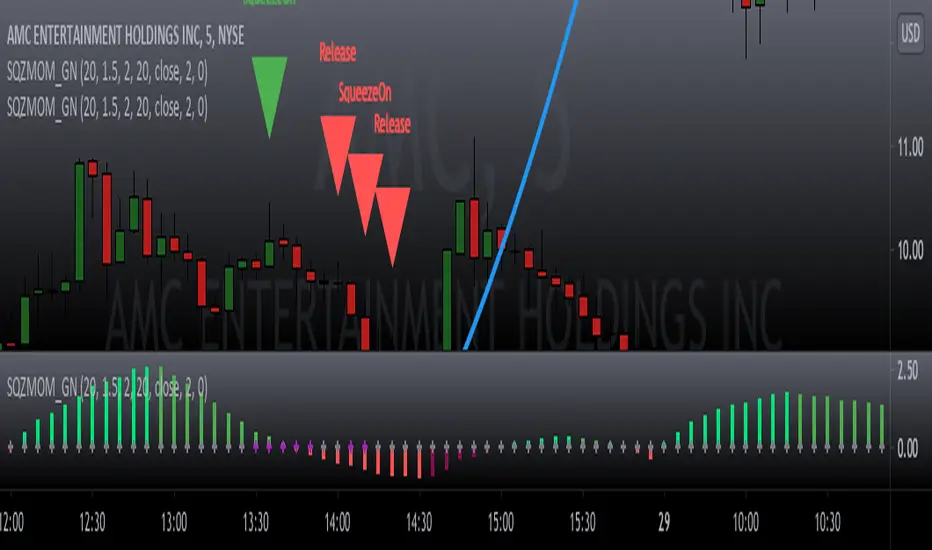
Companion script for Squeeze Momentum Indicator that plots the signal on chart.
版本注释
Squeeze Momentum Indicator shows when Bollinger Bands squeeze into the Keltner Channel. When this condition is met, price consolidation is typically followed by a move up or down. The histogram in the indicator helps predict direction of the price action breakout. If the histogram is flipping from red to green, the signal is bullish. If the histogram is flipping from green to red, the signal is bearish.This is a companion script that overlays the squeeze signals onto a chart.
版本注释
This script includes the direction of momentum using Red-Green triangles. A bullish signal occurs when the SqueezeOn triangle is Red and the Release triangle is Green; a bearish signal occurs when the SqueezOn triangle is Green and the Release triangle is red. 开源脚本
秉承TradingView的精神,该脚本的作者将其开源,以便交易者可以查看和验证其功能。向作者致敬!您可以免费使用该脚本,但请记住,重新发布代码须遵守我们的网站规则。
免责声明
这些信息和出版物并非旨在提供,也不构成TradingView提供或认可的任何形式的财务、投资、交易或其他类型的建议或推荐。请阅读使用条款了解更多信息。
免责声明
这些信息和出版物并非旨在提供,也不构成TradingView提供或认可的任何形式的财务、投资、交易或其他类型的建议或推荐。请阅读使用条款了解更多信息。