PROTECTED SOURCE SCRIPT
Composite RSI2/9
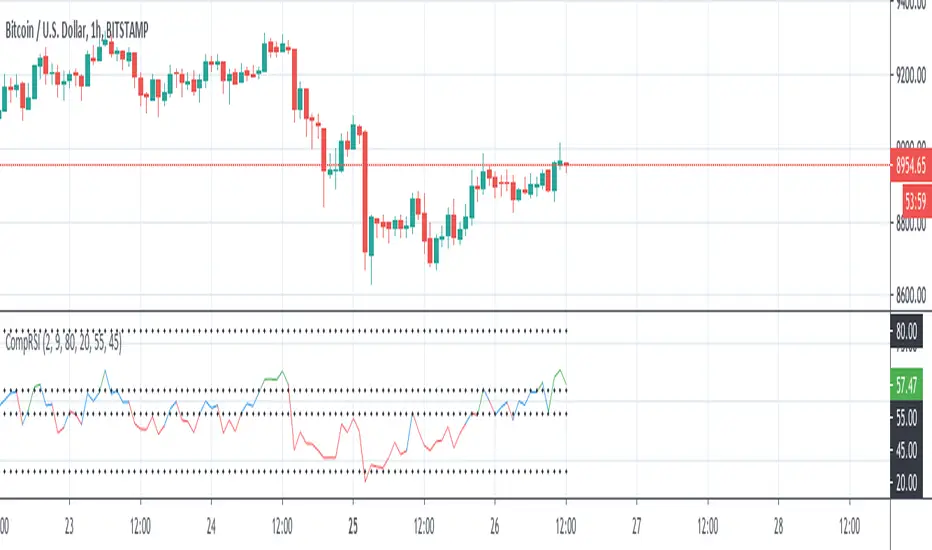
Composite RSI is a new way of calculating the RSI. Unlike the RSI that is a sort of a momentum indicator, composite RSI2/9 is more a trending indicator. It tends to filter out insignificant price changes and seems to be good in identifying the underlying trends.
This indicator shows the average RSI between two periods (default values are 2 and 9) considering the same for multiple timeframes.
For example if the average between RSI2 and RSI9 for 1H and 4H is crssed below static sell level (values is adjustable) it could be read as a signal of down trend.
I suggets to use with higher timeframe.
受保护脚本
此脚本以闭源形式发布。 但是,您可以自由使用,没有任何限制 — 了解更多信息这里。
免责声明
这些信息和出版物并非旨在提供,也不构成TradingView提供或认可的任何形式的财务、投资、交易或其他类型的建议或推荐。请阅读使用条款了解更多信息。
受保护脚本
此脚本以闭源形式发布。 但是,您可以自由使用,没有任何限制 — 了解更多信息这里。
免责声明
这些信息和出版物并非旨在提供,也不构成TradingView提供或认可的任何形式的财务、投资、交易或其他类型的建议或推荐。请阅读使用条款了解更多信息。