INVITE-ONLY SCRIPT
已更新 Rfactory: Ken Long RLCO Framework
Rfactory has partnered with Dr Ken Long of Tortoise Capital Management to provide his complete RLCO Framework into a single seamless TradingView indicator along with his most recent MACD Seasons work. This is by far the quickest and easiest way to get up and running with a beautifully crafted RLCO Framework in just a few clicks.
Dr Long developed the RLCO (Regression Line Cross Over) Framework as a statistical lens through which he trades the markets and has taught the approach to countless traders through Dr Van Tharp's IITM as well as his own workshops and trading community.
All elements of the Framework are preconfigured and the indicator includes a custom "Stats" overlay with daily range statistics (such as FrogBox, Hybrid FrogBox, Rangestat, etc). Each element of the RLCO Framework can be enabled or disabled at the click of a button via the indictor settings.
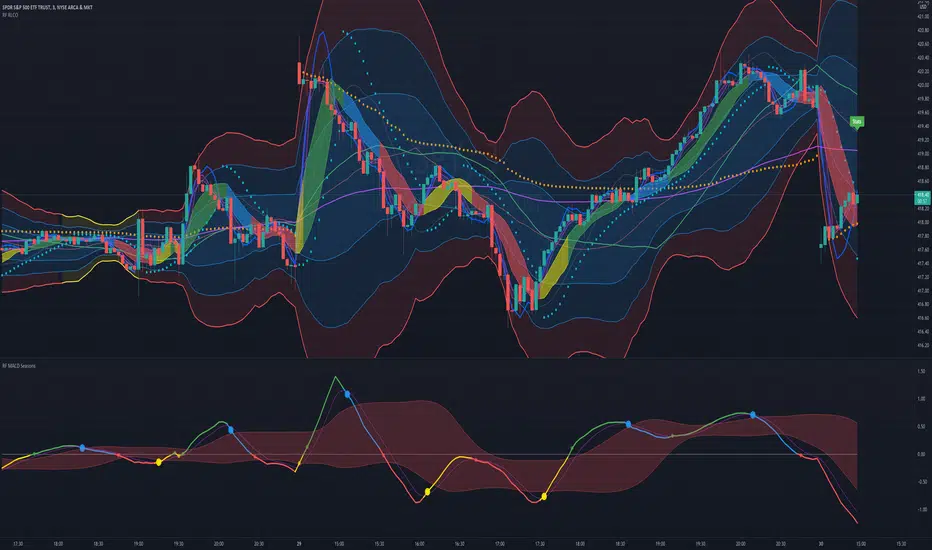
The RLCO Framework elements include the Linear Regression lines (RL10, RL30, RL90, RL270), the Bands (River, Flood Plain & Z3 Bands as well as the Dragon and the Baby Dragon) and a host of other Supplemental tools that are often used in conjunction with the above including VWAP, PSAR and the customized PSAR on the RL10 that Dr. Long pioneered.
In order to keep an eye on intraday volatility the Z3 bands will change color to yellow when we enter an SQC (Sideways Quiet Channel) environment to alert the trader.
Each element has been carefully designed with pre-configured and deliberate layering, coloring and translucency settings by default so it looks gorgeous out of the box but can also be customized to taste using the usual TradingView indicator settings.
For an even more intuitive experience you can monitor the MACD Season at a glance from within the RLCO Framework itself by coloring either the RL10 line or the Dragon by MACD Season which has become a very popular feature.
Also available (although it is a separate indicator it is included along with the framework) is the MACD Seasons Indicator which is loaded into its own sub-graph. All settings are preconfigured to be the same as Dr. Long uses out of the box and the plots include the MACD line colored by Season, the Signal line and the Red River. SSC (Spring Supported Crossing) Signals are specifically highlighted with large Dots on the MACD Line. Everything is customizable including not only coloring and line styles but also the underlying settings for lookbacks as well as a selector to use SMA's or EMA's for the calculations.
Dr Long developed the RLCO (Regression Line Cross Over) Framework as a statistical lens through which he trades the markets and has taught the approach to countless traders through Dr Van Tharp's IITM as well as his own workshops and trading community.
All elements of the Framework are preconfigured and the indicator includes a custom "Stats" overlay with daily range statistics (such as FrogBox, Hybrid FrogBox, Rangestat, etc). Each element of the RLCO Framework can be enabled or disabled at the click of a button via the indictor settings.
The RLCO Framework elements include the Linear Regression lines (RL10, RL30, RL90, RL270), the Bands (River, Flood Plain & Z3 Bands as well as the Dragon and the Baby Dragon) and a host of other Supplemental tools that are often used in conjunction with the above including VWAP, PSAR and the customized PSAR on the RL10 that Dr. Long pioneered.
In order to keep an eye on intraday volatility the Z3 bands will change color to yellow when we enter an SQC (Sideways Quiet Channel) environment to alert the trader.
Each element has been carefully designed with pre-configured and deliberate layering, coloring and translucency settings by default so it looks gorgeous out of the box but can also be customized to taste using the usual TradingView indicator settings.
For an even more intuitive experience you can monitor the MACD Season at a glance from within the RLCO Framework itself by coloring either the RL10 line or the Dragon by MACD Season which has become a very popular feature.
Also available (although it is a separate indicator it is included along with the framework) is the MACD Seasons Indicator which is loaded into its own sub-graph. All settings are preconfigured to be the same as Dr. Long uses out of the box and the plots include the MACD line colored by Season, the Signal line and the Red River. SSC (Spring Supported Crossing) Signals are specifically highlighted with large Dots on the MACD Line. Everything is customizable including not only coloring and line styles but also the underlying settings for lookbacks as well as a selector to use SMA's or EMA's for the calculations.
版本注释
v1.1- Changed the default way of calculating the Baby Dragon to match what Ken is using now. The previous method can still be enabled in settings.
- Fixed Stats box issue where decimal places for some symbols (ex: FX) sometimes prevented seeing all data. Now adapts decimal places to the symbol.
- Added a parameter for the HybridFrog Multiple used for the Stats Box calculation but default remains the standard 0.7
- Added FQN to Stats Box
- Added ATR and ATR% to Stats Box with a parameter for the ATR Lookback
- Added "Show Stats Box" parameter to enable/disable it
- Added Stats Box Vertical and Horizontal location parameters for more control over placement
仅限邀请脚本
只有作者授权的用户才能访问此脚本。您需要申请并获得使用许可。通常情况下,付款后即可获得许可。更多详情,请按照下方作者的说明操作,或直接联系JeffBoccaccio。
TradingView不建议您付费购买或使用任何脚本,除非您完全信任其作者并了解其工作原理。您也可以在我们的社区脚本找到免费的开源替代方案。
作者的说明
For access to this indicator please contact Rfactory via PM, http://www.rfactory.io or email info@rfactory.io
Trader & Systems Architect
Co-founder of Rfactory & TSL
Board Member at the Society of Technical Analysts
Helping traders grow with mindset & tools
📈 Tools ➝ rfactory.io/tradingview
🎧 Podcast ➝ rfactory.io/blog/categories/podcast
Co-founder of Rfactory & TSL
Board Member at the Society of Technical Analysts
Helping traders grow with mindset & tools
📈 Tools ➝ rfactory.io/tradingview
🎧 Podcast ➝ rfactory.io/blog/categories/podcast
免责声明
这些信息和出版物并非旨在提供,也不构成TradingView提供或认可的任何形式的财务、投资、交易或其他类型的建议或推荐。请阅读使用条款了解更多信息。