OPEN-SOURCE SCRIPT
Multi-Timeframe EMAs
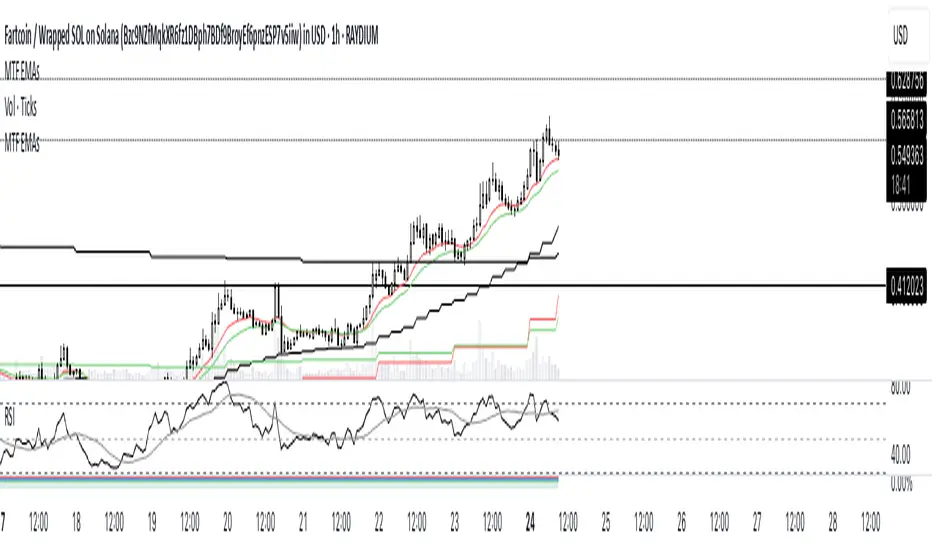
This TradingView indicator provides a comprehensive overview of price momentum by overlaying multiple Exponential Moving Averages (EMAs) from different timeframes onto a single chart. By combining 1-hour, 4-hour, and daily EMAs, you can observe short-term trends while simultaneously monitoring medium-term and long-term market dynamics. The 1-hour EMA 13 and EMA 21 help capture rapid price changes, which is useful for scalpers or intraday traders looking to identify sudden momentum shifts. Meanwhile, the 4-hour EMA 21 offers a more stable, intermediate perspective, filtering out some of the noise found in shorter intervals. Finally, the daily EMAs (13, 25, and 50) highlight prevailing market sentiment over a longer period, enabling traders to assess higher-level trends and gauge whether short-term signals align with overarching tendencies. By plotting all these EMAs together, it becomes easier to detect confluences or divergences across different time horizons, making it simpler to refine entries and exits based on multi-timeframe confirmation. This script is especially helpful for swing traders and position traders who wish to ensure that smaller timeframe strategies do not conflict with long-term market direction.
开源脚本
秉承TradingView的精神,该脚本的作者将其开源,以便交易者可以查看和验证其功能。向作者致敬!您可以免费使用该脚本,但请记住,重新发布代码须遵守我们的网站规则。
免责声明
这些信息和出版物并非旨在提供,也不构成TradingView提供或认可的任何形式的财务、投资、交易或其他类型的建议或推荐。请阅读使用条款了解更多信息。
开源脚本
秉承TradingView的精神,该脚本的作者将其开源,以便交易者可以查看和验证其功能。向作者致敬!您可以免费使用该脚本,但请记住,重新发布代码须遵守我们的网站规则。
免责声明
这些信息和出版物并非旨在提供,也不构成TradingView提供或认可的任何形式的财务、投资、交易或其他类型的建议或推荐。请阅读使用条款了解更多信息。