OPEN-SOURCE SCRIPT
Chervolinos-Wave-PM-Forecast
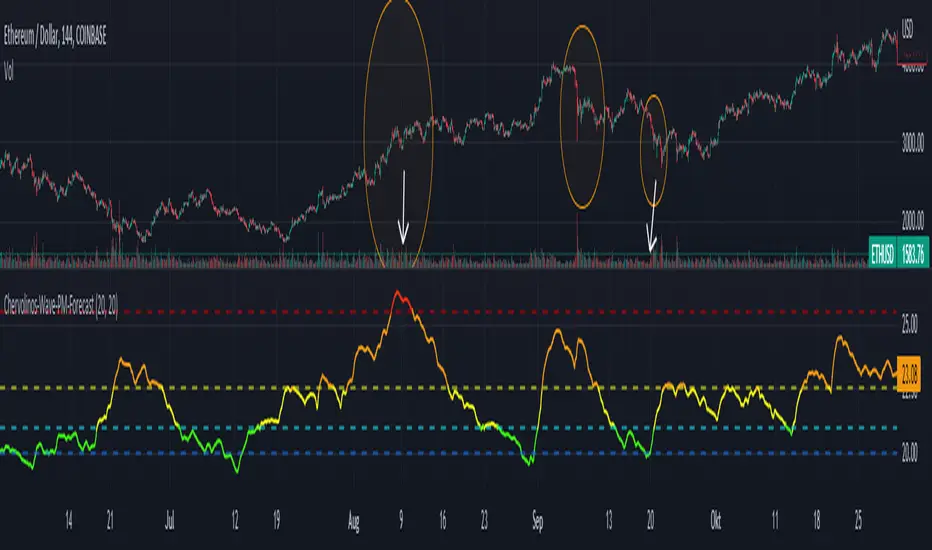
The Wave PM (Whistler Active Volatility Energy – Price Mass) indicator is an oscillator described in Mark Whistler's book, Volatility Illuminated.
The Wave PM is specifically designed to help read volatility cycles. When we visualize volatility cycles as a chart, we can get a clear view of the market volatility phases in multiple time frames. This indicator forms an arithmetic mean over 30 observed periods. Traders can thus get a better insight into "potential" volatility from up to pent-up energy, the different zones give strong help to predict future price developments.
Possible interpretation patterns:
You are at the end of a long uptrend and you want to know if the price is going to go down, if the indicator shows red and the value is above 25, it is likely to do so.
You're in a downtrend and there's a bit of a recovery phase, so you might be wondering if it's going to continue when the indicator shows green. It would go further with yellow, but with green it can be assumed that it is going down rapidly.
Special thanks to sourcey who programmed the 3D Wave-PM.
This variant of sourcey looks very nice, but was too confusing for me. In order to get a strong overview, forming an arithmetic mean is very useful.
I hope you and the Mods like my version
Best regards, Chervolino
开源脚本
秉承TradingView的精神,该脚本的作者将其开源,以便交易者可以查看和验证其功能。向作者致敬!您可以免费使用该脚本,但请记住,重新发布代码须遵守我们的网站规则。
免责声明
这些信息和出版物并非旨在提供,也不构成TradingView提供或认可的任何形式的财务、投资、交易或其他类型的建议或推荐。请阅读使用条款了解更多信息。
开源脚本
秉承TradingView的精神,该脚本的作者将其开源,以便交易者可以查看和验证其功能。向作者致敬!您可以免费使用该脚本,但请记住,重新发布代码须遵守我们的网站规则。
免责声明
这些信息和出版物并非旨在提供,也不构成TradingView提供或认可的任何形式的财务、投资、交易或其他类型的建议或推荐。请阅读使用条款了解更多信息。