OPEN-SOURCE SCRIPT
已更新 Brown's Exponential Smoothing Volatility Adjusted (BESVA)
Introduction:
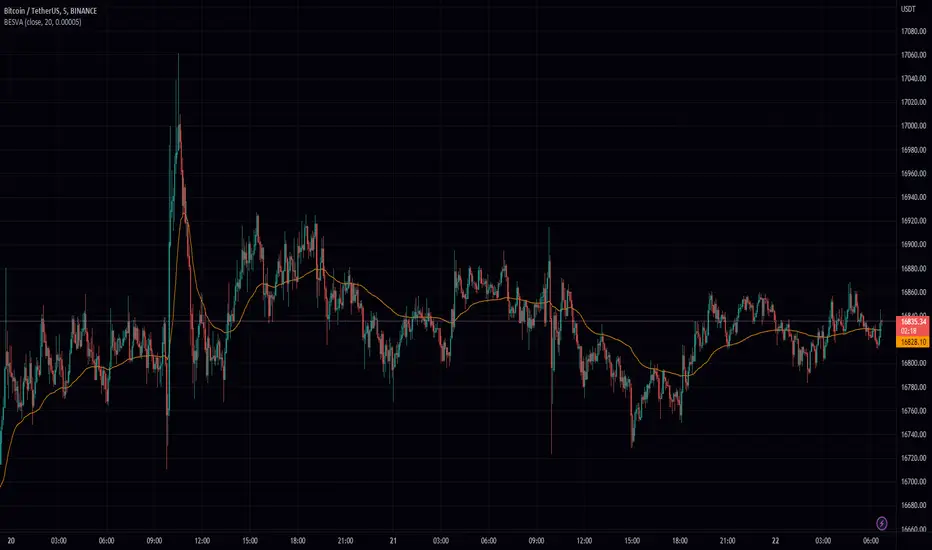
This script is a technical indicator for financial markets, designed to provide traders with a smoothed version of an asset's price using Brown's exponential smoothing method. The indicator adjusts the smoothing parameter based on the volatility of the asset, resulting in a smoother plot with less volatility and a quicker response to price changes with higher volatility.
Methodology:
The indicator begins by defining a length parameter, which determines the number of bars used in a volatility calculation. The user can input a value for this parameter, with a default of 20 bars.
Next, the script calculates the standard deviation of the asset's close price over the defined length, which serves as a measure of volatility. The standard deviation is then normalized by dividing it by the maximum standard deviation and adding a minimum value (set to 0.00005 by default). This normalization technique ensures that the indicator is comparable across different asset classes and time frames.
The normalized volatility measure is then used to adjust the smoothing parameter for the exponential moving average. Specifically, the smoothing parameter is set to the normalized volatility measure, with the minimum value used when the volatility is at its minimum. As the volatility increases, the smoothing parameter decreases, resulting in a quicker response to price changes.
The resulting smoothed price plot is then plotted on the chart.
Conclusion:
This script provides a useful tool for traders looking to analyze the trends in an asset's price while taking into account its volatility. The adjustable smoothing parameter ensures that the indicator responds appropriately to changes in volatility, making it a valuable addition to a trader's toolkit.
版本注释
added double smoothing option开源脚本
秉承TradingView的精神,该脚本的作者将其开源,以便交易者可以查看和验证其功能。向作者致敬!您可以免费使用该脚本,但请记住,重新发布代码须遵守我们的网站规则。
免责声明
这些信息和出版物并非旨在提供,也不构成TradingView提供或认可的任何形式的财务、投资、交易或其他类型的建议或推荐。请阅读使用条款了解更多信息。
开源脚本
秉承TradingView的精神,该脚本的作者将其开源,以便交易者可以查看和验证其功能。向作者致敬!您可以免费使用该脚本,但请记住,重新发布代码须遵守我们的网站规则。
免责声明
这些信息和出版物并非旨在提供,也不构成TradingView提供或认可的任何形式的财务、投资、交易或其他类型的建议或推荐。请阅读使用条款了解更多信息。