PROTECTED SOURCE SCRIPT
Student Wyckoff Effort Result Time
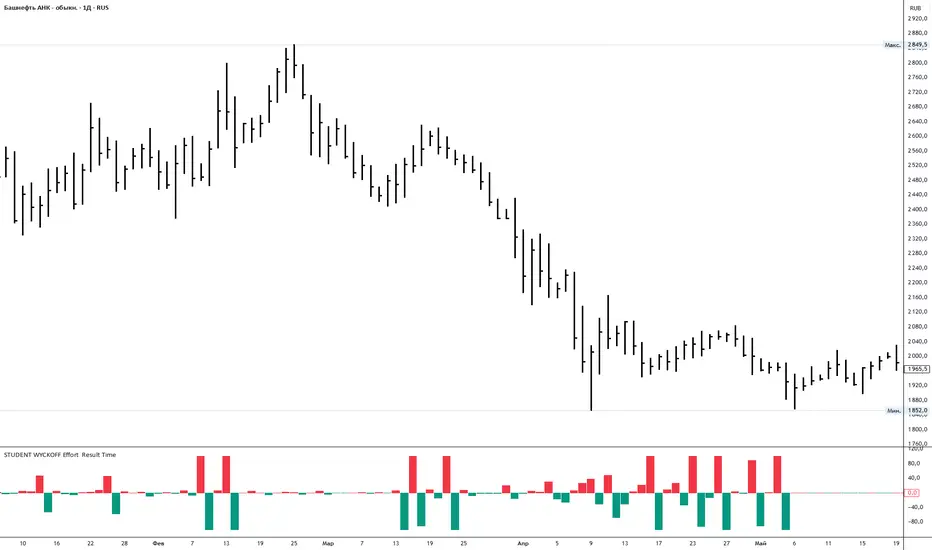
**STUDENT WYCKOFF Effort vs Result**
This tool measures how *hard* the market is working on every bar and compares the current effort with the previous one. It is built in the spirit of Wyckoff: first we look at the effort (volume), then at the result (price progress), and only after that compare them.
---
### Calculation (logic in simple terms)
For each bar the script:
1. Takes an **ERT window (N bars)** – by default 2 bars:
* **Effort (E)** = sum of volume over the last N bars.
* **Time (T)** = number of bars in the window = N.
* **Result (R)** = absolute % price change from the first bar in the window to the last bar.
2. Computes **ERT** as the “effort per unit of result”:
* More volume and smaller price move → higher ERT (movement is heavy).
* Less volume and bigger price move → lower ERT (movement is easy).
3. Plots a **histogram of ΔERT** – the difference between the current ERT and the previous ERT:
* **Red bar above 0** – current ERT > previous ERT →
*the last N bars were heavier than the previous N bars*.
* **Teal bar below 0** – current ERT < previous ERT →
*the last N bars were easier than the previous N bars*.
4. Optional **normalization window** rescales ΔERT over the last M bars, so extreme spikes do not destroy the readability of the whole histogram. It does not change the logic, only the visual scale.
---
### How to use
* Look for **clusters of high red bars** – segments where price needs noticeably more effort than before to make progress. On up-moves this often appears before slowing, churning or topping; on down-moves it often appears near potential stopping zones.
* Look for **deep teal bars** – segments where price moves easier than before. On rallies this can confirm a strong trend; on declines it can confirm strong selling pressure.
* Divergences between price and the pattern of heavy/light ΔERT can highlight zones where the balance between effort and result is shifting.
Inputs:
* **ERT window (bars)** – how many bars are used to measure effort and result (N).
* **Normalize ΔERT for readability** – on/off for visual normalization.
* **Normalization window (bars)** – how many last bars are used to adapt the scale.
* Colors for “current ERT heavier than previous” and “current ERT lighter than previous”.
受保护脚本
此脚本以闭源形式发布。 但是,您可以自由使用,没有任何限制 — 了解更多信息这里。
Уже 18 лет я торгую на рынках
免责声明
这些信息和出版物并非旨在提供,也不构成TradingView提供或认可的任何形式的财务、投资、交易或其他类型的建议或推荐。请阅读使用条款了解更多信息。
受保护脚本
此脚本以闭源形式发布。 但是,您可以自由使用,没有任何限制 — 了解更多信息这里。
Уже 18 лет я торгую на рынках
免责声明
这些信息和出版物并非旨在提供,也不构成TradingView提供或认可的任何形式的财务、投资、交易或其他类型的建议或推荐。请阅读使用条款了解更多信息。