INVITE-ONLY SCRIPT
NVME Candles Creator Experimental
//Note://
This is an experimental indicator that may provide you with useful information or it may not depending on how you use it and more information can be found below!
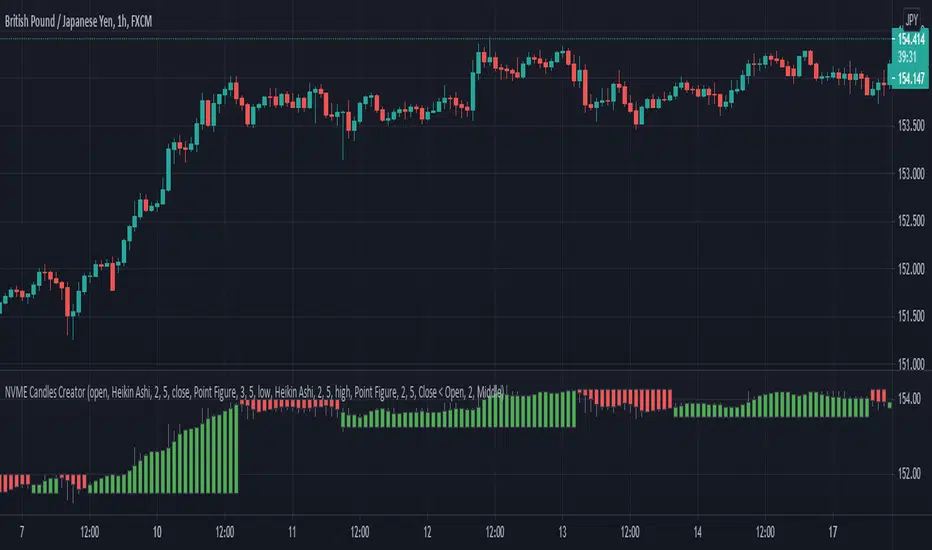
NVME Candle Creator indicator is an experimental indicator that allows you as the user to build your own candlestick system within a click of a button. The indicator uses data from 5 different chart series including the following: The default candle stick, Heikin Ashi, Renko (ATR Version), Kagi and the Point and Figure chart. Since there are 4 pieces of data from a candle plot such as the open, the close, the high and the low, we are able to edit each individually with our own data using the security() function and the chart series functions that are linked to the those specific charts. This indicator is designed to be used as a second chart alternative without having to take much screen space, however there are other uses to it such as using this indicator to find information about other chart types and possibly creating a noise free chart series using our integrated colour scheme system.
The features of this indicator are the following:
Sources (1-4) : These are customisable by changing the item listed on the drop down menu, the items displayed will be data from the charts such as open, close, high, low, hl2, hl3, and ohcl etc. There are 4 of these inputs as this will change the data that you are grabbing for the series. (Series 1 -> Close, Series 2 -> Open, Series 3 -> High, Series 4 -> Low)
Candle Style (1-4) : This is the chart series we will be using to get the final output of the indicator, this can be changed by selecting a different item in the dropdown menu. The following content of this drop down menu are: Default (Japanese Candlesticks), Heikin Ashi Candlesticks, ATR (Renko Version), Kagi and Point and Figure. These will strongly determine the final output of the indicator as they can change what data will be represented and how it will be displayed.
Length (1-4) : The value in this input field only affects the following candle style options: ATR, Kagi and Point and Figure. The reason is because these chart series include a customisable input in the form of reversal points or ATR value. Changing this value will determine the final design of the indicator as it can make the candles larger or smaller depending on the number inside the box.
Custom Timeframe (1-4) : This toggle will allow you to fetch data from a different timeframe of choice, however disabling this will fetch data from the current timeframe period.
Timeframe Value (1-4) : This input field is only active when the custom timeframe is enabled and this will change the security function so that it grabs data from the timeframe inputted and this can change the indicator's output so that the candles will look different but it doesn't have a significant change compared to the candle style feature.
Colour Filter: (Affects the candles plotted)
Option 1: "Close > Open" - Recolours the candles in a manner where candles will be green if that candle is greater than the open and the candles will be red if the close is less than the open.
Option 2: "Close < Open" - Recolours the candles in a manner where candles will be red if that candle is greater than the open and the candles will be green if the close is less than the open. (May be useful for some settings where the plots are different) - Use this as a colour correction.
Option 3: "None" - The colours will be removed so you will have to manually change it.
Dashboard: This can be turned off or turned on however it doesn't contain anything useful only a reminder that it isn't recommended to use this indicator alone as it is designed as an experimental indicator.
This is an experimental indicator that may provide you with useful information or it may not depending on how you use it and more information can be found below!
NVME Candle Creator indicator is an experimental indicator that allows you as the user to build your own candlestick system within a click of a button. The indicator uses data from 5 different chart series including the following: The default candle stick, Heikin Ashi, Renko (ATR Version), Kagi and the Point and Figure chart. Since there are 4 pieces of data from a candle plot such as the open, the close, the high and the low, we are able to edit each individually with our own data using the security() function and the chart series functions that are linked to the those specific charts. This indicator is designed to be used as a second chart alternative without having to take much screen space, however there are other uses to it such as using this indicator to find information about other chart types and possibly creating a noise free chart series using our integrated colour scheme system.
The features of this indicator are the following:
Sources (1-4) : These are customisable by changing the item listed on the drop down menu, the items displayed will be data from the charts such as open, close, high, low, hl2, hl3, and ohcl etc. There are 4 of these inputs as this will change the data that you are grabbing for the series. (Series 1 -> Close, Series 2 -> Open, Series 3 -> High, Series 4 -> Low)
Candle Style (1-4) : This is the chart series we will be using to get the final output of the indicator, this can be changed by selecting a different item in the dropdown menu. The following content of this drop down menu are: Default (Japanese Candlesticks), Heikin Ashi Candlesticks, ATR (Renko Version), Kagi and Point and Figure. These will strongly determine the final output of the indicator as they can change what data will be represented and how it will be displayed.
Length (1-4) : The value in this input field only affects the following candle style options: ATR, Kagi and Point and Figure. The reason is because these chart series include a customisable input in the form of reversal points or ATR value. Changing this value will determine the final design of the indicator as it can make the candles larger or smaller depending on the number inside the box.
Custom Timeframe (1-4) : This toggle will allow you to fetch data from a different timeframe of choice, however disabling this will fetch data from the current timeframe period.
Timeframe Value (1-4) : This input field is only active when the custom timeframe is enabled and this will change the security function so that it grabs data from the timeframe inputted and this can change the indicator's output so that the candles will look different but it doesn't have a significant change compared to the candle style feature.
Colour Filter: (Affects the candles plotted)
Option 1: "Close > Open" - Recolours the candles in a manner where candles will be green if that candle is greater than the open and the candles will be red if the close is less than the open.
Option 2: "Close < Open" - Recolours the candles in a manner where candles will be red if that candle is greater than the open and the candles will be green if the close is less than the open. (May be useful for some settings where the plots are different) - Use this as a colour correction.
Option 3: "None" - The colours will be removed so you will have to manually change it.
Dashboard: This can be turned off or turned on however it doesn't contain anything useful only a reminder that it isn't recommended to use this indicator alone as it is designed as an experimental indicator.
仅限邀请脚本
只有作者授权的用户才能访问此脚本。您需要申请并获得使用许可。通常情况下,付款后即可获得许可。更多详情,请按照下方作者的说明操作,或直接联系Crypto_Samm。
TradingView不建议您付费购买或使用任何脚本,除非您完全信任其作者并了解其工作原理。您也可以在我们的社区脚本找到免费的开源替代方案。
作者的说明
You will be granted access on TradingView within 2-8 hours after you purchase on our website: https://www.nvmetrading.com We advise you to take a look at our product and discord group before considering using our services! Docs + discord in our website!
Visit our website to get access: nvmetrading.com
You can also find videos, images, documentation and other resources there too.
Join Our Discord: discord.gg/2CY7BYTySR
You can also find videos, images, documentation and other resources there too.
Join Our Discord: discord.gg/2CY7BYTySR
免责声明
这些信息和出版物并非旨在提供,也不构成TradingView提供或认可的任何形式的财务、投资、交易或其他类型的建议或推荐。请阅读使用条款了解更多信息。