OPEN-SOURCE SCRIPT
Dual Bollinger Bands (20 & 200)
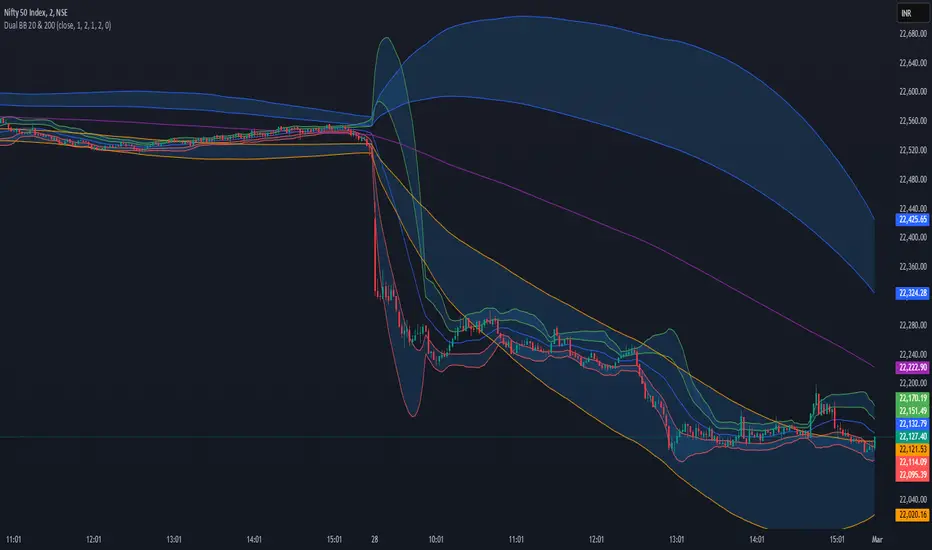
Dual Bollinger Bands (20 & 200) - Enhanced Trading Strategy
Overview
The Dual Bollinger Bands (20 & 200) indicator is an enhanced version of the Double Bollinger Bands by Alixnet. This advanced tool integrates two sets of Bollinger Bands with 20-period (short-term) and 200-period (long-term) moving averages, helping traders identify market trends, volatility, and potential trade setups more effectively.
Key Features
✅ Two Bollinger Band Sets – Short-term (20-period) and Long-term (200-period).
✅ Enable/Disable Each BB – Customize visibility for better analysis.
✅ Multiple Standard Deviations – Identify different levels of volatility.
✅ Background Fill for Clarity – Highlights volatility zones.
How to Use This Indicator Effectively
1. Understanding the Two Bollinger Bands
BB1 (20-Period): Measures short-term price movements and volatility.
BB2 (200-Period): Acts as a long-term trend filter to determine the dominant trend.
2. Trade Entries & Exits
Bullish Trade Setup (Long Entry)
🔹 Price Above 200 MA Basis Line (BB2) – Confirms an uptrend.
🔹 Price Pulls Back to the Lower Band of BB1 (20 MA) – Ideal buy opportunity.
🔹 Confirmation: If price bounces off the lower BB1 band and moves back toward the midline or upper band, enter a long position.
🔹 Exit: When price touches or exceeds the upper BB1 band.
Bearish Trade Setup (Short Entry)
🔹 Price Below 200 MA Basis Line (BB2) – Confirms a downtrend.
🔹 Price Pulls Back to the Upper Band of BB1 (20 MA) – Ideal short opportunity.
🔹 Confirmation: If price gets rejected at the upper BB1 band and moves downward, enter a short position.
🔹 Exit: When price reaches or drops below the lower BB1 band.
3. Avoiding Sideways Markets
❌ Avoid trading when price stays between the two bands of BB1 without breaking out.
❌ Flat 200 MA Line (BB2 Basis) indicates a ranging market – best to wait for a breakout.
✅ Wait for Price to Cross the 200 MA Basis Line to confirm trend direction before entering trades.
4. Catching Trending Moves
✅ Strong Trend Confirmation: When price stays above or below the 20-period BB bands and also above/below the 200-period MA.
✅ Trend Continuation: If price consolidates near the upper or lower bands without breaking opposite levels.
✅ Breakout Confirmation: Look for a candle close outside BB1 bands with momentum to confirm strong moves.
Final Thoughts
The Dual Bollinger Bands (20 & 200) indicator is a powerful tool for both short-term traders and long-term investors. By combining the short-term volatility of the 20-period BB with the long-term trend of the 200-period BB, traders can make more informed trading decisions, filter out noise, and capture high-probability trade setups.
开源脚本
In true TradingView spirit, the creator of this script has made it open-source, so that traders can review and verify its functionality. Kudos to the author! While you can use it for free, remember that republishing the code is subject to our House Rules.
免责声明
The information and publications are not meant to be, and do not constitute, financial, investment, trading, or other types of advice or recommendations supplied or endorsed by TradingView. Read more in the Terms of Use.