OPEN-SOURCE SCRIPT
已更新 Dot indicator - Daily candle opened above the daily EMA baseline
https://www.tradingview.com/x/PHTOoLHz/
//version=3
//Written by David Carruthers
//Objective
//This is to support scanning the market to check if the daily candle opened above the daily EMA baseline for a selected pair
//This can be done in some measure by using trading view's screening tools
//However it would be useful, if someone references a pair, to instantly see if that pair opened above the daily baseline regardless of what resolution you are in
//This script, works out a green dot if the pairs daily candle opened above the daily EMA baseline, and a red dot if it didn't
//It then displays a green or red dot on the open for the last candle you are looking at regardless of resolution
//This saves jumping back and forth between the daily resolution and current resolution
Note please excuse my Pine scripting I am new to it :-)
版本注释
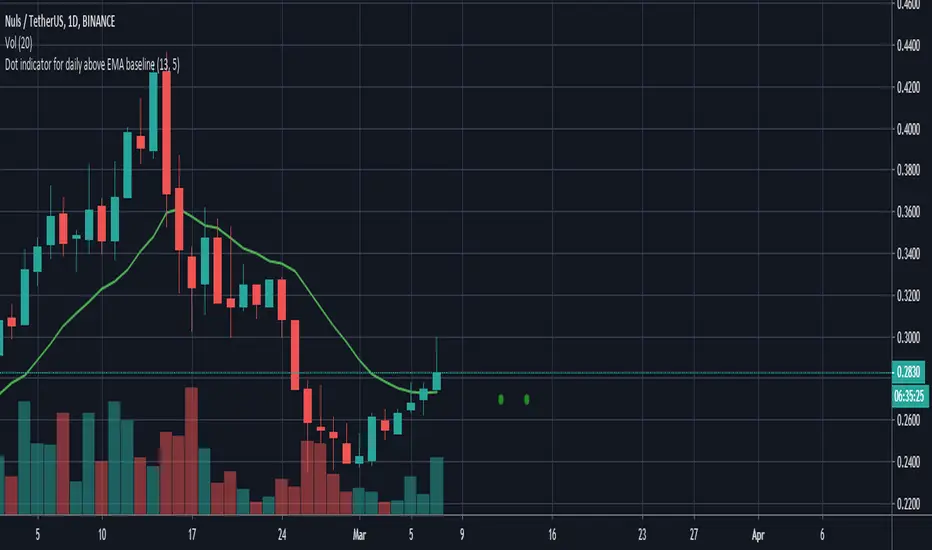
Brand new version of the Daily baseline scriptThere are now 2 x dots offset to the right
Left dot: Did the current daily candle open above the daily EMA baseline ?
Right dot: Did the latest candle in the current resolution open above the Daily EMA baseline?
This allows you to keep on an resolution, for example 1 hour, and if I see a green dot to the left and a red dot to the right, I can see that the daily candle opened above the EMA baseline, but the current hourly is below it.
开源脚本
秉承TradingView的精神,该脚本的作者将其开源,以便交易者可以查看和验证其功能。向作者致敬!您可以免费使用该脚本,但请记住,重新发布代码须遵守我们的网站规则。
免责声明
这些信息和出版物并非旨在提供,也不构成TradingView提供或认可的任何形式的财务、投资、交易或其他类型的建议或推荐。请阅读使用条款了解更多信息。
开源脚本
秉承TradingView的精神,该脚本的作者将其开源,以便交易者可以查看和验证其功能。向作者致敬!您可以免费使用该脚本,但请记住,重新发布代码须遵守我们的网站规则。
免责声明
这些信息和出版物并非旨在提供,也不构成TradingView提供或认可的任何形式的财务、投资、交易或其他类型的建议或推荐。请阅读使用条款了解更多信息。