OPEN-SOURCE SCRIPT
Momentum Arrows
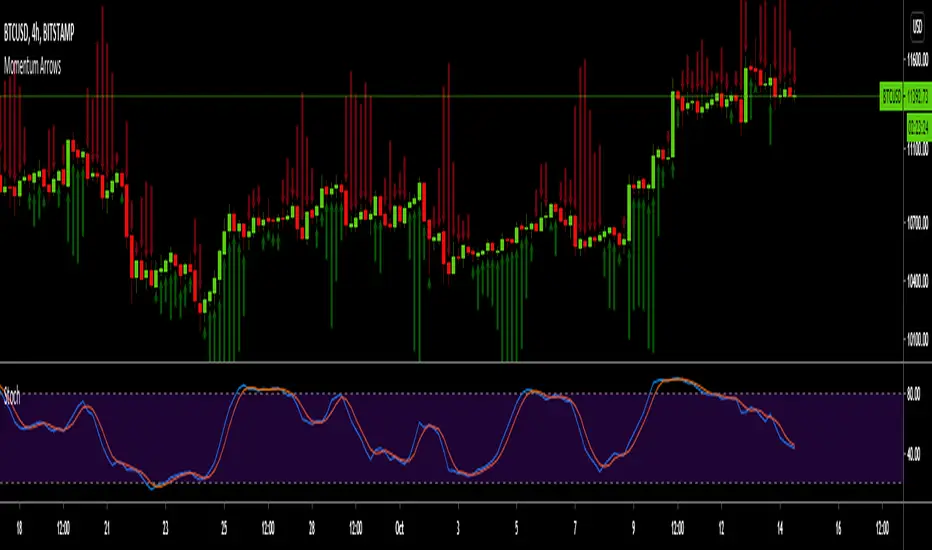
This simple indicators paints the Momentum based on Stochastic, RSI or WaveTrend onto the Price Chart by showing Green or Red arrows.
In the settings it can be selected which indicator is used, Stochastic is selected by default.
Length of the arrows is determined by the strength of the momentum:
Stochastic: Difference between D and K
RSI: Difference from RSI-50
WaveTrend: Difference between the Waves
(Thanks to LazyBear for the WaveTrend inspiration)
PS:
If anyone has an idea how to conditionally change the color of the arrows, then please let me know - that would be the icing on the cake. Then it would be possible to indicate Overbought/Oversold levels with different colors.
Unfortunately it currently seems not to be possible to dynamically change the arrow colour.
开源脚本
秉承TradingView的精神,该脚本的作者将其开源,以便交易者可以查看和验证其功能。向作者致敬!您可以免费使用该脚本,但请记住,重新发布代码须遵守我们的网站规则。
The new Order Block Finder V2 is available as invite-only script. Please visit the website for all the details and how to get access:
sites.google.com/view/wugamlo-indicators/
sites.google.com/view/wugamlo-indicators/
免责声明
这些信息和出版物并非旨在提供,也不构成TradingView提供或认可的任何形式的财务、投资、交易或其他类型的建议或推荐。请阅读使用条款了解更多信息。