OPEN-SOURCE SCRIPT
Tradytics Levels with EMA Cloud
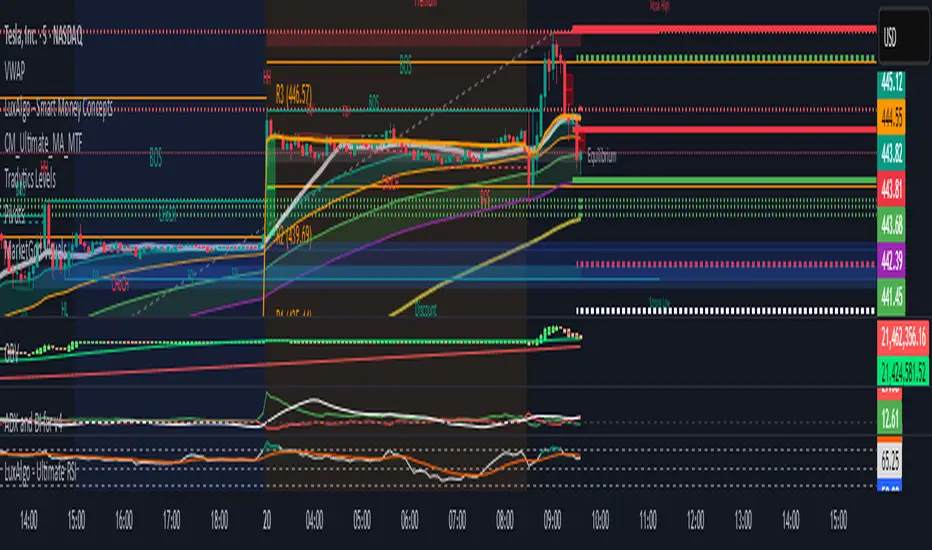
This indicator has tradytics price chart levels where you can put in the input code seen below.
The code has positive gamma (green lines), negative gamma (Red lines) and white dotted line are the darkpool levels.
This is Amazon's 5 minute from Sep30th to October 20th Gammas and weekly Darkpool levels. Just copy and paste code below in the input code and the chart would show the levels.
212.8*1*neutral 220.07*1*neutral 216.038*1*neutral 215.57*1*neutral 219.988*1*neutral 217.401*1*neutral 217.351*1*neutral 212.815*1*neutral 212.75*1*neutral 212.4*1*neutral 215*0*negative 222.5*0*positive 217.5*0*positive 220*0*positive
开源脚本
秉承TradingView的精神,该脚本的作者将其开源,以便交易者可以查看和验证其功能。向作者致敬!您可以免费使用该脚本,但请记住,重新发布代码须遵守我们的网站规则。
免责声明
这些信息和出版物并非旨在提供,也不构成TradingView提供或认可的任何形式的财务、投资、交易或其他类型的建议或推荐。请阅读使用条款了解更多信息。
开源脚本
秉承TradingView的精神,该脚本的作者将其开源,以便交易者可以查看和验证其功能。向作者致敬!您可以免费使用该脚本,但请记住,重新发布代码须遵守我们的网站规则。
免责声明
这些信息和出版物并非旨在提供,也不构成TradingView提供或认可的任何形式的财务、投资、交易或其他类型的建议或推荐。请阅读使用条款了解更多信息。