OPEN-SOURCE SCRIPT
[MAD] Fibonacci Bands with Smoothing
Hi, this is just an easy script, nothing special, it was a request from a community member and was finished in just 40 minutes :D
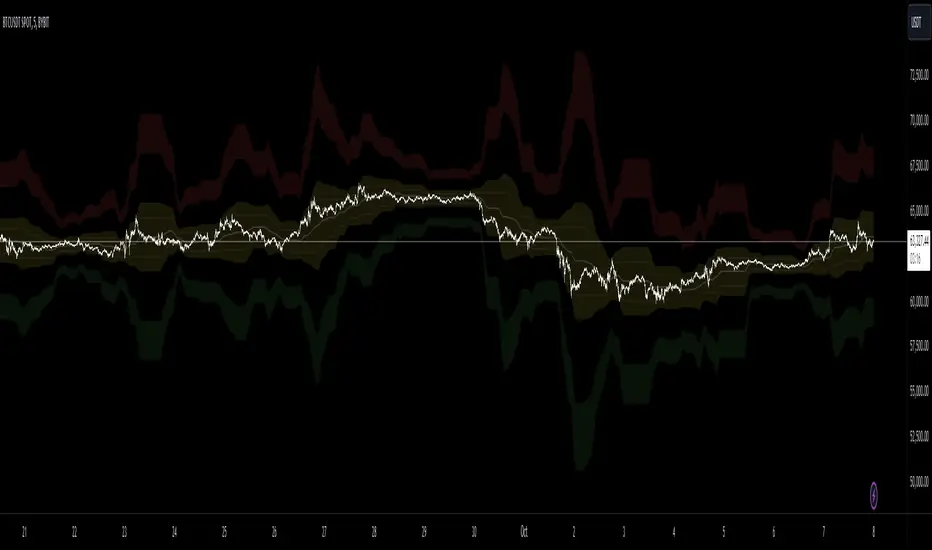
This indicator offers a approach to tracking market price movements by utilizing Fibonacci-based levels combined with customizable smoothing options for both the bands and the high/low values.
Key Features:
Customizable Moving Averages: Choose from a variety of smoothing methods, including SMA, EMA, WMA, HMA, VWMA, and advanced Ehlers-based methods.
This allows for flexible adaptation to different assets.
Multiple Fibonacci Band Multipliers: The user can define six different multipliers for both the upper and lower Fibonacci bands, allowing for granular customization of the indicator. The middle line serves as the central reference, and the multipliers extend the bands outward based on price range dynamics.
High/Low Smoothing: In addition to smoothing the Fibonacci bands, users can apply smoothing to the high and low prices that form the basis for calculating the Fibonacci bands. This ensures that the indicator responds smoothly to market movements, reducing noise while capturing key trends.
Forward Shift Option: Allows for projecting the bands into the future by shifting the calculated levels forward by a user-specified number of periods. This feature is particularly useful for those interested in anticipating price actions and future trends.
Visual Enhancements: The indicator features filled regions between bands to clearly visualize the zones of price movement. The fills between the bands offer insight into potential support and resistance zones, based on price levels defined by the Fibonacci ratios.
How It Works:
The indicator uses the highest and lowest closing prices over a specified lookback period to establish a price range. Based on this range, it calculates the middle line (0.5 level) and applies user-defined Fibonacci multipliers to generate both upper and lower bands. Users have control over the smoothing method for both the high/low prices and the bands themselves, allowing for an adaptive experience that can be tailored to different timeframes or market conditions.
For visualization, areas between the upper and lower bands are filled with distinct colors, providing an intuitive view of the potential price zones where the market might react or consolidate.
These fills highlight the zones created by the Fibonacci bands, helping users identify critical market levels with ease.
have fun
p.s.: frankchef hope that suits your needs & expectations ;-)
开源脚本
秉承TradingView的精神,该脚本的作者将其开源,以便交易者可以查看和验证其功能。向作者致敬!您可以免费使用该脚本,但请记住,重新发布代码须遵守我们的网站规则。
免责声明
这些信息和出版物并非旨在提供,也不构成TradingView提供或认可的任何形式的财务、投资、交易或其他类型的建议或推荐。请阅读使用条款了解更多信息。
免责声明
这些信息和出版物并非旨在提供,也不构成TradingView提供或认可的任何形式的财务、投资、交易或其他类型的建议或推荐。请阅读使用条款了解更多信息。