OPEN-SOURCE SCRIPT
Kalman Sigmoid Z-score | SurgeQuant
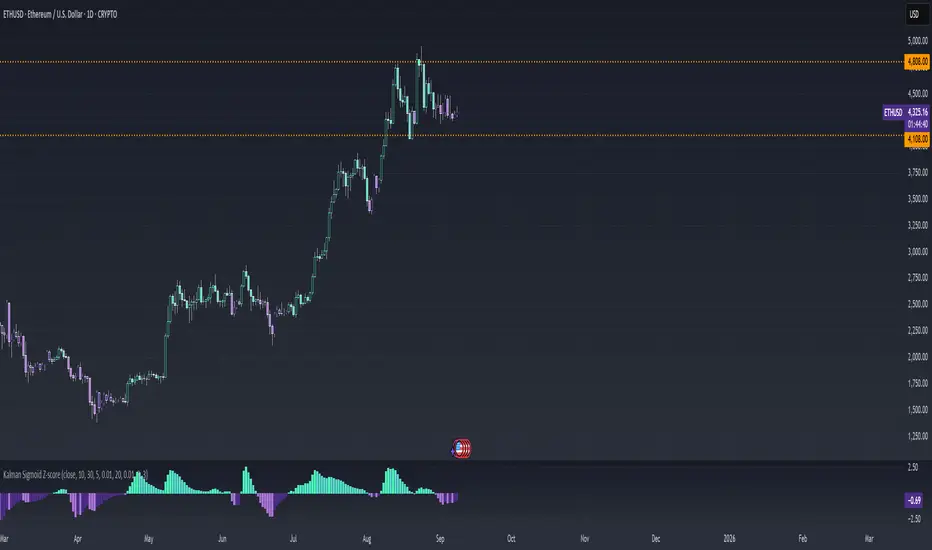
Title: Kalman Sigmoid Z-score Indicator
The Kalman Sigmoid Z-score indicator is a sophisticated tool designed to identify market momentum and potential trend changes using a combination of Kalman filtering, sigmoid-weighted averaging, and Z-score calculations. By processing price data through a Kalman filter and applying adaptive sigmoid weighting, this indicator provides clear visual signals for bullish and bearish market conditions. The Z-score output and price bars are dynamically colored to highlight momentum shifts, aiding traders in identifying potential trading opportunities.
How It Works
Kalman Filter Calculation
Computes a smoothed price series using a Kalman filter based on a user-selected price source (Close, High, Low, or Open) with configurable parameters for process noise, measurement noise, and filter order (default: 3).
The Kalman filter reduces noise in the price data, providing a stable foundation for further analysis.
Sigmoid-Weighted Averaging
Applies a sigmoid function to calculate adaptive weights based on price comparisons over a user-defined lookback period (default: 10).
Weights are adjusted dynamically using a volatility ratio (standard deviation over ATR) to account for market conditions, enhancing signal reliability.
Z-score Calculation
Calculates the Z-score of the Kalman-filtered price relative to a sigmoid-weighted moving average over a user-defined period (default: 20).
Bullish Signal: Triggered when the Z-score crosses above 0, indicating potential upward momentum.
Bearish Signal: Triggered when the Z-score crosses below 0, indicating potential downward momentum.
Visual Representation
The indicator provides a clear and customizable visual interface:
Z-score Histogram: Displayed as colored columns, with distinct colors for bullish (Z-score > 0) and bearish (Z-score < 0) conditions.
Bright green (#4DFFBE) for rising Z-score above 0.
Light green (#56DFCF) for falling Z-score above 0.
Dark purple (#AE75DA) for falling Z-score below 0.
Light purple (#4D2D8C) for rising Z-score below 0.
Price Bar Coloring: Synchronizes with the Z-score colors to reflect momentum on the main chart.
Reference Line: A zero line is plotted on the Z-score panel for easy reference.
Customization & Parameters
The Kalman Sigmoid Z-score indicator offers flexible parameters to suit various trading styles:
Source: Select the input price (default: Close; options: Close, High, Low, Open).
Lookback Period: Set the period for sigmoid weight calculations (default: 10).
Volatility Period: Adjust the period for volatility ratio calculation (default: 30).
Base Steepness: Control the sigmoid function’s sensitivity (default: 5).
Base Midpoint: Set the sigmoid function’s midpoint (default: 0.01).
Z-score Period: Define the period for Z-score calculation (default: 20).
Kalman Parameters:
Process Noise (default: 0.01).
Measurement Noise (default: 3).
Filter Order (default: 3).
Color Settings: Predefined colors with distinct shades for bullish and bearish states, ensuring clear visual differentiation.
Trading Applications
This indicator is versatile and can be applied across various markets and strategies:
Momentum Trading: Highlights strong bullish or bearish momentum for potential entry or exit points based on Z-score crossings.
Trend Confirmation: Use bar coloring to confirm Z-score signals with price action on the main chart.
Reversal Detection: Identify potential reversals when the Z-score crosses the zero line.
Scalping and Swing Trading: Adjust parameters (e.g., lookback, Z-score period) to suit short-term or longer-term strategies.
Final Note
The Kalman Sigmoid Z-score indicator is a powerful tool for traders seeking to leverage advanced filtering and statistical analysis for momentum and trend-based opportunities. Its combination of Kalman-filtered price smoothing, sigmoid-weighted averaging, dynamic Z-score signals, and synchronized bar coloring offers a robust framework for informed trading decisions. As with all indicators, backtest thoroughly and integrate into a comprehensive trading strategy for optimal results. This indicator is provided for educational and informational purposes and should not be considered financial advice.
开源脚本
秉承TradingView的精神,该脚本的作者将其开源,以便交易者可以查看和验证其功能。向作者致敬!您可以免费使用该脚本,但请记住,重新发布代码须遵守我们的网站规则。
免责声明
这些信息和出版物并非旨在提供,也不构成TradingView提供或认可的任何形式的财务、投资、交易或其他类型的建议或推荐。请阅读使用条款了解更多信息。
开源脚本
秉承TradingView的精神,该脚本的作者将其开源,以便交易者可以查看和验证其功能。向作者致敬!您可以免费使用该脚本,但请记住,重新发布代码须遵守我们的网站规则。
免责声明
这些信息和出版物并非旨在提供,也不构成TradingView提供或认可的任何形式的财务、投资、交易或其他类型的建议或推荐。请阅读使用条款了解更多信息。