OPEN-SOURCE SCRIPT
已更新 Fibonacci Trading
Fibonacci Trading
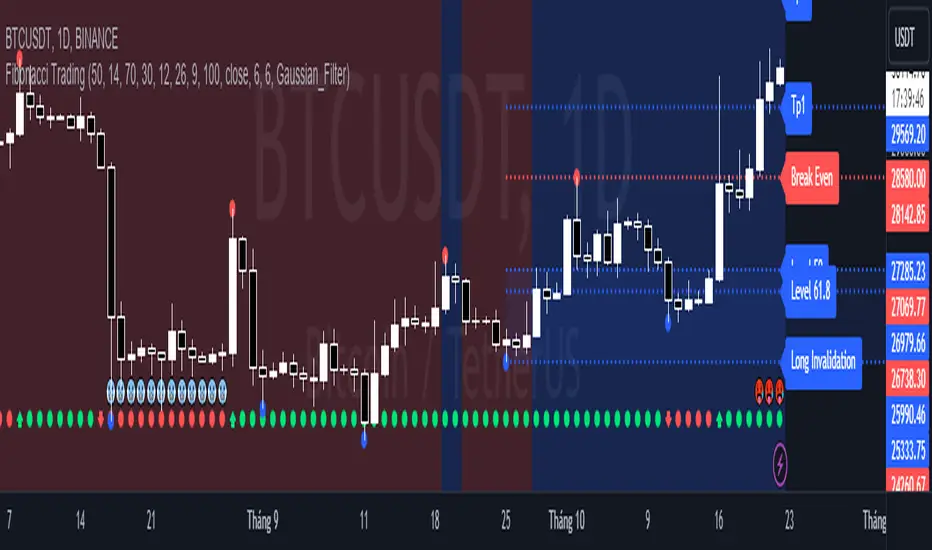
This simple script draw Fibonacci Retracement to define pullback level and draw Fibonacci Extension to define target level of a upward wave or doward wave
1. Upward wave
1.1 Fibonacci Retracement
+ Fibonacci Retracement measuare from support to nearest resistance on the right.
+ Retracement Level 0 named as "Breake Even"
+ Retracement Level 100 named as "Long Invalidation"
+ Retracement Level 50 and 61.8 is ploted as blue line
+ The zone between Retracement Level 50 and 100 is filled by blue color and named as "Buy zone"
1.2 Fibonacci Extension
+ Fibonacci Extension measuare from Retracement Level 61.8 to Retracement Level 0
+ Fibonacci Extension Level 161.8 named as "Tp1 (Target point 1)"
+ Fibonacci Extension Level 261.8 named as "Tp2 (Target point 2)"
2. Doward wave
2.1 Fibonacci Retracement
+ Fibonacci Retracement measuare from resistance to nearest support on the right.
+ Retracement Level 0 named as "Breake Even"
+ Retracement Level 100 named as "Short Invalidation"
+ Retracement Level 50 and 61.8 is ploted as red line
+ The zone between Retracement Level 50 and 100 is filled by red color and named as "Sell zone"
2.2 Fibonacci Extension
+ Fibonacci Extension measuare from Retracement Level 61.8 to Retracement Level 0
+ Fibonacci Extension Level 161.8 named as "Tp1 (Target point 1)"
+ Fibonacci Extension Level 261.8 named as "Tp2 (Target point 2)"
3. Trading Setup
3.1 Long Only: Only display Fibonacci of Upward wave
3.2 Short Only: Only display Fibonacci of Doward wave
3.3 Both: Display both Fibonacci of Upward wave and Doward wave
版本注释
Update Feature MA Cycle in Trading Setup.3.4 MA Cycle: When EMA above SMA auto display Fibonacci of Upward wave, When EMA below SMA auto display Fibonacci of Downward wave.
Notes: When EMA above SMA, background is filled by blue. When EMA below SMA, background is filled by red. Uncheck "Fill background" to disable filling.
版本注释
Update Feature RSI MACD in Trading Setup3.5 RSI MACD:
* When RSI cross down over sold level and then MACD create Buy Signal this script auto display Fibonacci of Upward wave
* When RSI cross up over bought level and then MACD create Sell Signal this script auto display Fibonacci of Downward wave
* Notes:
+ When MACD create Buy Signal after RSI oversold, background is filled by blue.
+ When MACD create Sell Signal after RSI overbought, background is filled by red.
+ Uncheck "RSI MACD Background Filling" to disable filling.
版本注释
Update feature Gaussian Filter in Trading Setup3.6 Gaussian Filter:
* When price moving above Gaussian Filter, this script auto display Fibonacci of Upward wave.
* When price moving below Gaussian Filter, this script auto display Fibonacci of Downward wave.
* Notes:
+ When price moving above Gaussian Filter, background is filled by blue.
+ When price moving below Gaussian Filter, background is filled by red.
+ Uncheck Fill background to disable filling.
开源脚本
秉承TradingView的精神,该脚本的作者将其开源,以便交易者可以查看和验证其功能。向作者致敬!您可以免费使用该脚本,但请记住,重新发布代码须遵守我们的网站规则。
免责声明
这些信息和出版物并非旨在提供,也不构成TradingView提供或认可的任何形式的财务、投资、交易或其他类型的建议或推荐。请阅读使用条款了解更多信息。
免责声明
这些信息和出版物并非旨在提供,也不构成TradingView提供或认可的任何形式的财务、投资、交易或其他类型的建议或推荐。请阅读使用条款了解更多信息。