OPEN-SOURCE SCRIPT
Bitcoin Bubble Risk (Adjusted for Diminishing Returns)
Description:
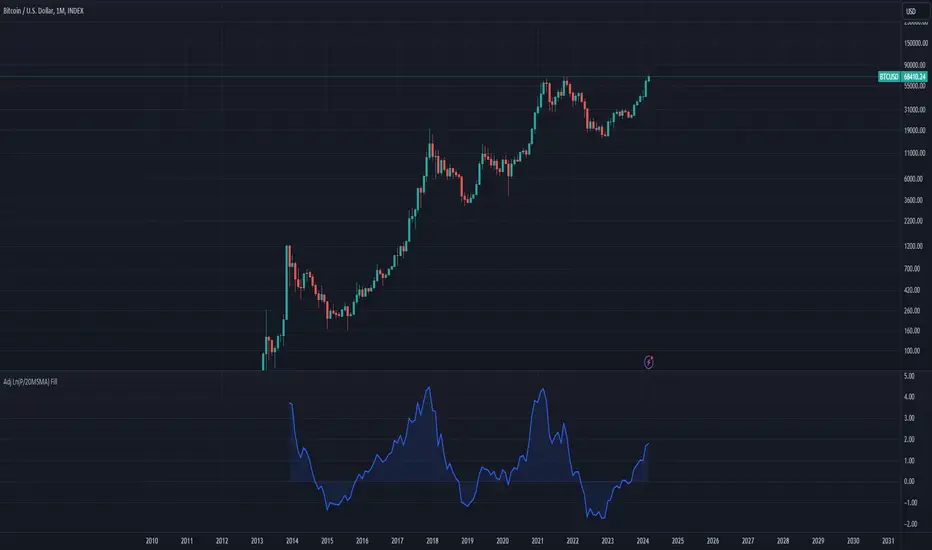
This indicator offers a unique lens through which traders can assess risk in the Bitcoin market, specifically tailored to recognize the phenomenon of diminishing returns. By calculating the natural logarithm of the price relative to a 20-month Simple Moving Average (SMA) and applying a dynamic normalization process, this tool highlights periods of varying risk based on historical price movements and adjusted returns. The indicator is designed to provide nuanced insights into potential risk levels, aiding traders in their decision-making processes.
Usage:
To effectively use this indicator, apply it to your chart while ensuring that Bitcoin's price is set to display in monthly candles. This setting is vital for the indicator to accurately reflect the market's risk levels, as it relies on long-term data aggregation to inform its analysis.
This tool is especially beneficial for traders focused on medium to long-term investment horizons in Bitcoin, offering insights into when the market may be entering higher or lower risk phases. By incorporating this indicator into your analysis, you can gain a deeper understanding of potential risk exposures based on the adjusted price trends and market conditions.
Originality and Utility:
This script stands out for its innovative approach to risk analysis in the cryptocurrency space. By adjusting for the diminishing returns seen in mature markets, it provides a refined perspective on risk levels, enhancing traditional methodologies. This script is a significant contribution to the TradingView community, offering a unique tool for traders aiming to navigate the complexities of the Bitcoin market with informed risk management strategies.
Important Note:
This indicator is for informational purposes only and should not be considered investment advice. Users are encouraged to conduct their own research and consult with financial professionals before making investment decisions. The accuracy of the indicator's predictions can only be ensured when applied to monthly candlestick charts of Bitcoin.
开源脚本
秉承TradingView的精神,该脚本的作者将其开源,以便交易者可以查看和验证其功能。向作者致敬!您可以免费使用该脚本,但请记住,重新发布代码须遵守我们的网站规则。
免责声明
这些信息和出版物并非旨在提供,也不构成TradingView提供或认可的任何形式的财务、投资、交易或其他类型的建议或推荐。请阅读使用条款了解更多信息。
开源脚本
秉承TradingView的精神,该脚本的作者将其开源,以便交易者可以查看和验证其功能。向作者致敬!您可以免费使用该脚本,但请记住,重新发布代码须遵守我们的网站规则。
免责声明
这些信息和出版物并非旨在提供,也不构成TradingView提供或认可的任何形式的财务、投资、交易或其他类型的建议或推荐。请阅读使用条款了解更多信息。