INVITE-ONLY SCRIPT
Momentum Line
What is this?
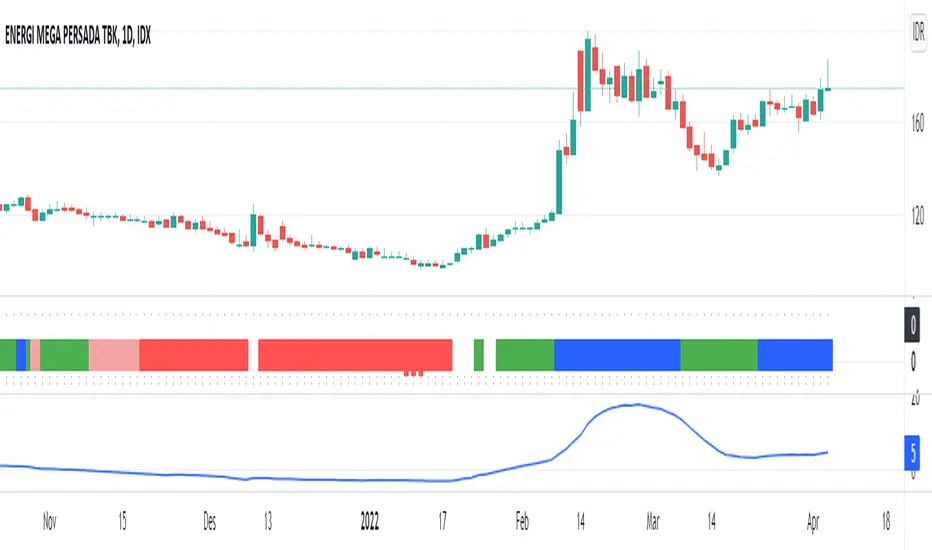
Momentum line (a blue line at the bottom area) tells you the short term trend movement of price. It will useful when the major trend is not developed-well. This line is not for a single use. We suggest you to use it with our other module: Trend Optimizer module, as shown above the momentum line.
Indicator & Strategies:
Momentum Line is based on moving average convergence divergence (MACD). We don't use the histogram, we don't concern the 2 lines crossing. So we blend the two lines into single lines.
See the charts, see the trend color (trend optimizer module) when it changed from long red color into white. It shows the medium trend changed from strong downtrend into neutral. But since the long term trend (the vertical trend bar below) is still not yet changed into green, the major trend (medium & long term) is still in development process. This is when we need to look at momentum line. If it pointing up, it gives confirmation that the uptrend is developing and you can buy the stocks using trend or swing strategies 9our profit trader module)
Benefit For you:
You can detect an early bottom reversal phase especially when you combine this momentum line script with out trend optimizer script.
仅限邀请脚本
仅限作者授权的用户访问此脚本,并且通常需要付费。您可以将其添加到收藏中,但是只有在向作者请求并获得许可之后,才能使用它。 请联系galerisaham了解更多信息,或按照以下作者的说明操作。
TradingView不建议付费使用脚本,除非您100%信任作者并了解脚本的工作原理。在许多情况下,您可以在我们的社区脚本免费找到不错的开源替代方案。
作者的说明
″To use this scipt, visit https://galerisaham.com/modul for further information.
想在图表上使用此脚本?
警告:请在申请访问权限之前阅读。
We Build Profitable Traders | Visit: galerisaham.com/pro/
免责声明
这些信息和出版物并不意味着也不构成TradingView提供或认可的金融、投资、交易或其它类型的建议或背书。请在使用条款阅读更多信息。