PROTECTED SOURCE SCRIPT
r - g Oscillator | Norm + Sigma-Bands
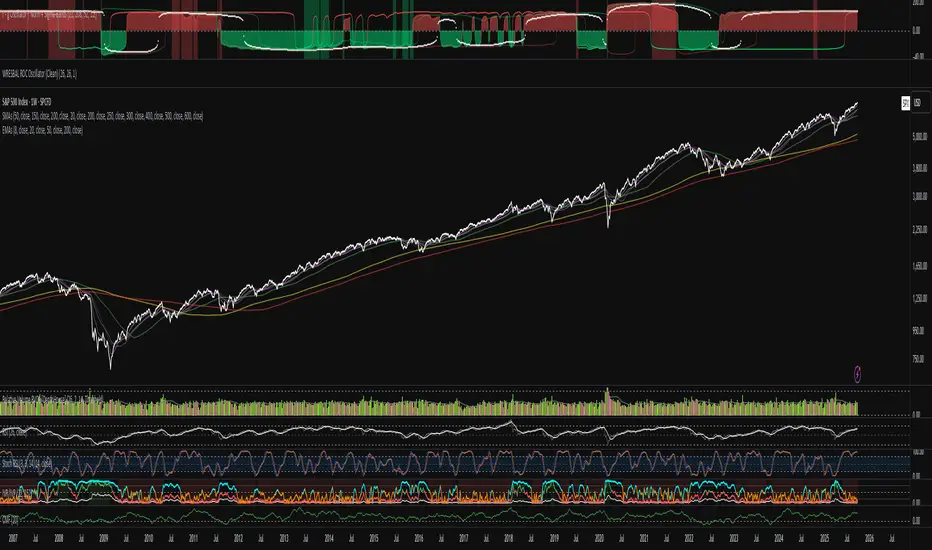
The r–g Oscillator measures the macro-liquidity regime by tracking the gap between real interest rates (r) and nominal GDP growth (g).
It approximates real rate pressure using the 10-Year Treasury yield minus the 5-Year/5-Year forward inflation expectation, and compares that to either Real or Nominal U.S. GDP YoY growth.
Green (g > r): Expansionary backdrop — growth outpaces real yields; liquidity tailwinds.
Red (r > g): Contractionary backdrop — real rates restrictive; liquidity headwinds.
The σ-bands (standard-deviation envelopes) highlight statistically extreme expansions or contractions in the r–g spread.
The “sweet-spot” shading marks moments when r–g breaks strongly above/below zero — early-cycle thrusts or late-cycle stress.
Optional normalization rescales r–g between –1 and +1 to compare across cycles.
Use:
Track shifts in the macro tide rather than short-term waves. Sustained green phases typically align with bull-market environments; red phases often coincide with tightening cycles or recessions. Combine with faster liquidity or breadth measures (e.g., WRESBAL ROC) for tactical confirmation.
受保护脚本
此脚本以闭源形式发布。 但是,您可以自由使用,没有任何限制 — 了解更多信息这里。
免责声明
这些信息和出版物并非旨在提供,也不构成TradingView提供或认可的任何形式的财务、投资、交易或其他类型的建议或推荐。请阅读使用条款了解更多信息。
受保护脚本
此脚本以闭源形式发布。 但是,您可以自由使用,没有任何限制 — 了解更多信息这里。
免责声明
这些信息和出版物并非旨在提供,也不构成TradingView提供或认可的任何形式的财务、投资、交易或其他类型的建议或推荐。请阅读使用条款了解更多信息。