OPEN-SOURCE SCRIPT
Double EMA & SMA
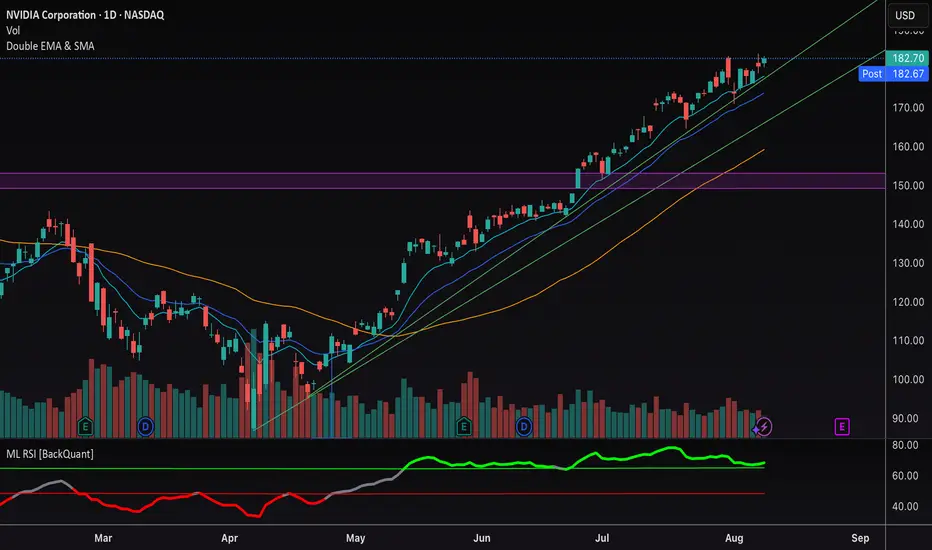
This indicator plots two Exponential Moving Averages (EMAs) and one Simple Moving Average (SMA) directly on the price chart to help identify market trends and momentum shifts.
By default, it displays:
• EMA 1 (10-period) – short-term trend
• EMA 2 (20-period) – medium-term trend
• SMA (50-period) – broader trend baseline
The combination allows traders to quickly spot trend direction, potential reversal points, and areas of dynamic support or resistance. Suitable for scalping, swing trading, and longer-term analysis across any market.
开源脚本
秉承TradingView的精神,该脚本的作者将其开源,以便交易者可以查看和验证其功能。向作者致敬!您可以免费使用该脚本,但请记住,重新发布代码须遵守我们的网站规则。
免责声明
这些信息和出版物并非旨在提供,也不构成TradingView提供或认可的任何形式的财务、投资、交易或其他类型的建议或推荐。请阅读使用条款了解更多信息。
免责声明
这些信息和出版物并非旨在提供,也不构成TradingView提供或认可的任何形式的财务、投资、交易或其他类型的建议或推荐。请阅读使用条款了解更多信息。