OPEN-SOURCE SCRIPT
已更新 Portfolio Summary
The stocks in my portfolio has very poor performance since the FED hiked the rate.
since the covid-19, i came to the stock market and buy a stock that i ever heard the name which i don't even know its fundamental.
Some stock, i bought them at the hilltop (and sell at the bottom, hehe).
Everyone is a genius in a bull market ; and now i realized i am gonna loss money.
I have to do something, so i looked for an indicator that allow me to manage my portfolio.
unfortunately, i cannot find one that fit me.
so i make this indicator.
How you can get the benefit from this indicator
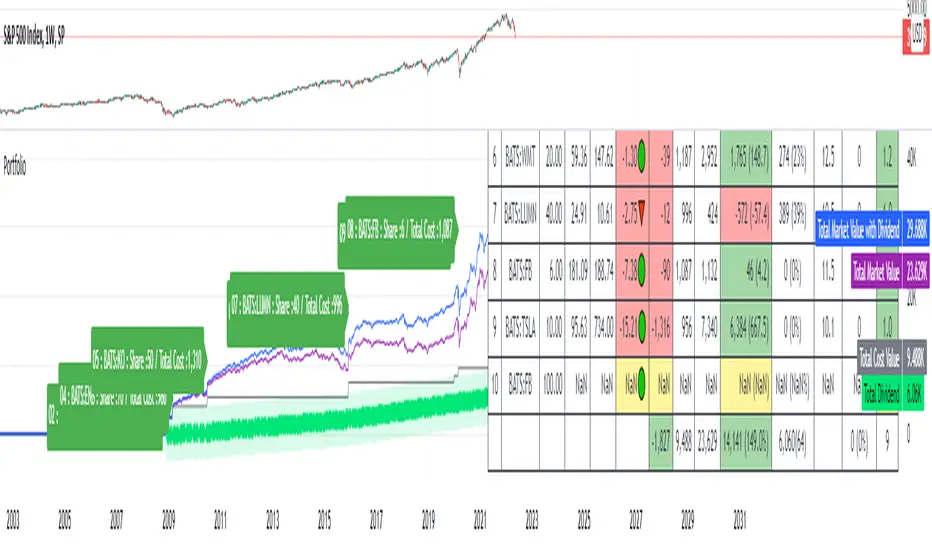
This indicator will summarize the gain/loss since you bought the stock.
it also include the dividend.
So that you can see how much you gain and loss, and make a decision as you wish.
How to use it
1. Input some neccessary data like ticker/stock (up to 20 tickers, yeah i know, it is too much), share, average price which you can input manually or depend on your entry date.
2. The indicator will calculate gain/loss, dividend, % of your portfolio.
3. You can select how to display based on "Index" or "Market Value".
4. You can toggle on/off both label and table.
Disclaimer
This indicator may display inaccurate and need a lot of improvement.
pls use carefully.
if you have any suggestion, pls dont hersitate to comment below.
Enjoy.


since the covid-19, i came to the stock market and buy a stock that i ever heard the name which i don't even know its fundamental.
Some stock, i bought them at the hilltop (and sell at the bottom, hehe).
Everyone is a genius in a bull market ; and now i realized i am gonna loss money.
I have to do something, so i looked for an indicator that allow me to manage my portfolio.
unfortunately, i cannot find one that fit me.
so i make this indicator.
How you can get the benefit from this indicator
This indicator will summarize the gain/loss since you bought the stock.
it also include the dividend.
So that you can see how much you gain and loss, and make a decision as you wish.
How to use it
1. Input some neccessary data like ticker/stock (up to 20 tickers, yeah i know, it is too much), share, average price which you can input manually or depend on your entry date.
2. The indicator will calculate gain/loss, dividend, % of your portfolio.
3. You can select how to display based on "Index" or "Market Value".
4. You can toggle on/off both label and table.
Disclaimer
This indicator may display inaccurate and need a lot of improvement.
pls use carefully.
if you have any suggestion, pls dont hersitate to comment below.
Enjoy.
版本注释
Symbol error fixed.版本注释
- Rearranged the script.
- Added stop loss, take profit based on price, percent and ATR.
- Added alert if market price hit entry price, stop loss price and target price.
- Reduced number of asset from 20 to 10 assets for better performance.
Enjoy.
PS.
1) Use at your own risk.
2) Next improvement : Portfolio benmarking, CAPM.
开源脚本
秉承TradingView的精神,该脚本的作者将其开源,以便交易者可以查看和验证其功能。向作者致敬!您可以免费使用该脚本,但请记住,重新发布代码须遵守我们的网站规则。
免责声明
这些信息和出版物并非旨在提供,也不构成TradingView提供或认可的任何形式的财务、投资、交易或其他类型的建议或推荐。请阅读使用条款了解更多信息。
免责声明
这些信息和出版物并非旨在提供,也不构成TradingView提供或认可的任何形式的财务、投资、交易或其他类型的建议或推荐。请阅读使用条款了解更多信息。