OPEN-SOURCE SCRIPT
Multi-Indicator Signal with Table
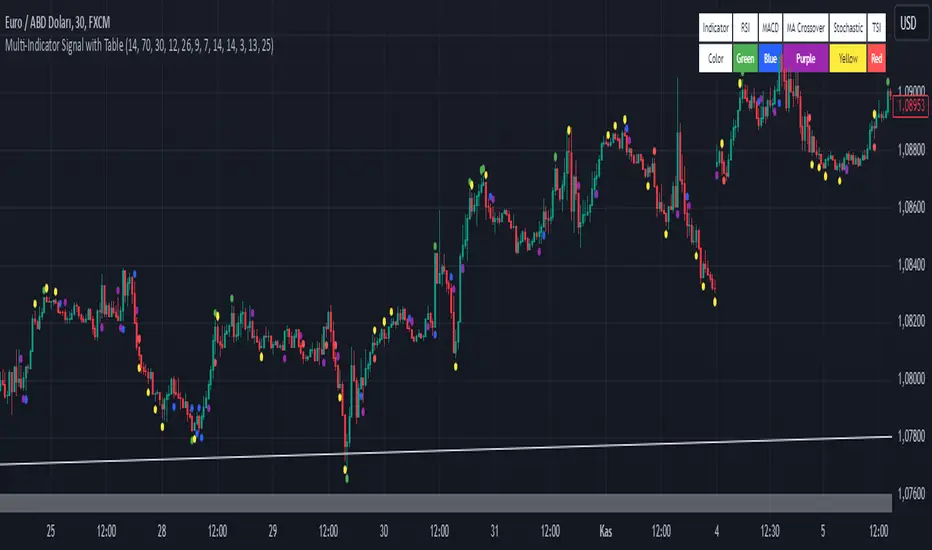
This indicator is a versatile multi-indicator tool designed for traders who want to combine signals from various popular indicators into a single framework. It not only visualizes buy and sell signals but also provides a clear, easy-to-read table that summarizes the included indicators and their respective signal colors.
Key Features:
RSI (Relative Strength Index):
Buy Signal: RSI falls below the oversold level (default: 30).
Sell Signal: RSI rises above the overbought level (default: 70).
Signal Color: Green.
MACD (Moving Average Convergence Divergence):
Buy Signal: MACD line crosses above the signal line.
Sell Signal: MACD line crosses below the signal line.
Signal Color: Blue.
MA Crossover (Moving Average Crossover):
Buy Signal: Short EMA (default: 7) crosses above Long SMA (default: 14).
Sell Signal: Short EMA crosses below Long SMA.
Signal Color: Purple.
Stochastic Oscillator:
Buy Signal: Stochastic %K falls below 20 and crosses above %D.
Sell Signal: Stochastic %K rises above 80 and crosses below %D.
Signal Color: Yellow.
TSI (True Strength Index):
Buy Signal: TSI crosses above the zero line.
Sell Signal: TSI crosses below the zero line.
Signal Color: Red.
Dynamic Signal Table:
A clean, compact table displayed at the top-right corner of the chart, summarizing the indicators and their respective signal colors for quick reference.
Customization:
All indicator parameters are fully adjustable, allowing users to fine-tune settings to match their trading strategy.
Signal colors and table design ensure a visually intuitive experience.
Usage:
This tool is ideal for traders who prefer a multi-indicator approach for generating buy/sell signals.
The combination of different indicators helps to filter out noise and increase the accuracy of trade setups.
Notes:
Signals appear only after the confirmation of the current bar to avoid false triggers.
This indicator is designed for educational purposes and should be used in conjunction with proper risk management strategies.
开源脚本
秉承TradingView的精神,该脚本的作者将其开源,以便交易者可以查看和验证其功能。向作者致敬!您可以免费使用该脚本,但请记住,重新发布代码须遵守我们的网站规则。
免责声明
这些信息和出版物并非旨在提供,也不构成TradingView提供或认可的任何形式的财务、投资、交易或其他类型的建议或推荐。请阅读使用条款了解更多信息。
免责声明
这些信息和出版物并非旨在提供,也不构成TradingView提供或认可的任何形式的财务、投资、交易或其他类型的建议或推荐。请阅读使用条款了解更多信息。