PROTECTED SOURCE SCRIPT
已更新 Super Signal - Bollinger Bands
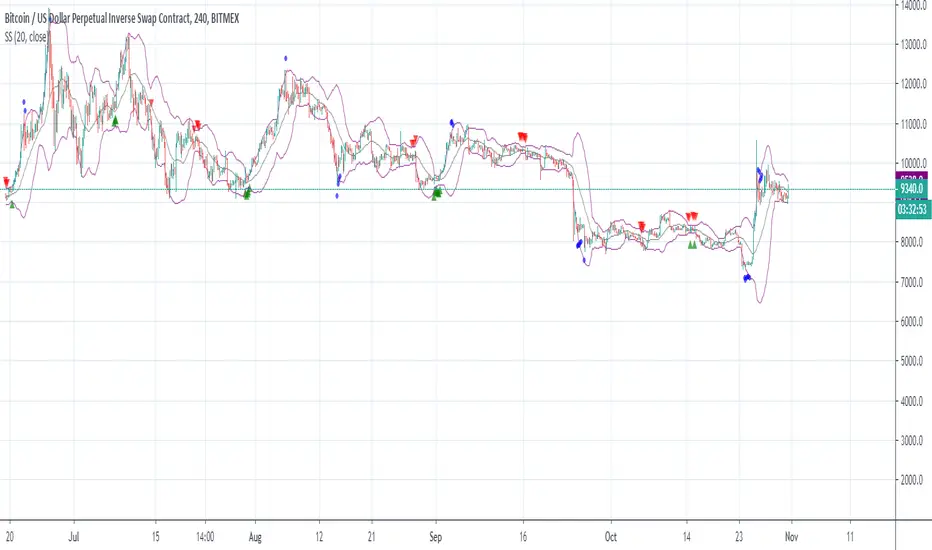
Bollinger Bands are price channels, or bands, that are plotted above and below price. The outer Bollinger Bands are based on price volatility, which means that they expand when the price fluctuates and trends strongly, and the Bands contract during sideways consolidations and low momentum trends. By using a combination of several indicators, we try to predict the direction of a large price movement when the Bands are compressed and the market is in a consolidation period.
To use the indicator:
Go long on the green arrows.
Go short on the red arrows.
The blue circles give a clear indication of when a trend has ended.
To use the indicator:
Go long on the green arrows.
Go short on the red arrows.
The blue circles give a clear indication of when a trend has ended.
版本注释
Slight adjustments to the algorithm have been made to improve signals.版本注释
Slight adjustments to improve signals受保护脚本
此脚本以闭源形式发布。 但是,您可以自由使用,没有任何限制 — 了解更多信息这里。
免责声明
这些信息和出版物并非旨在提供,也不构成TradingView提供或认可的任何形式的财务、投资、交易或其他类型的建议或推荐。请阅读使用条款了解更多信息。
免责声明
这些信息和出版物并非旨在提供,也不构成TradingView提供或认可的任何形式的财务、投资、交易或其他类型的建议或推荐。请阅读使用条款了解更多信息。