PROTECTED SOURCE SCRIPT
CC - ATR Bands
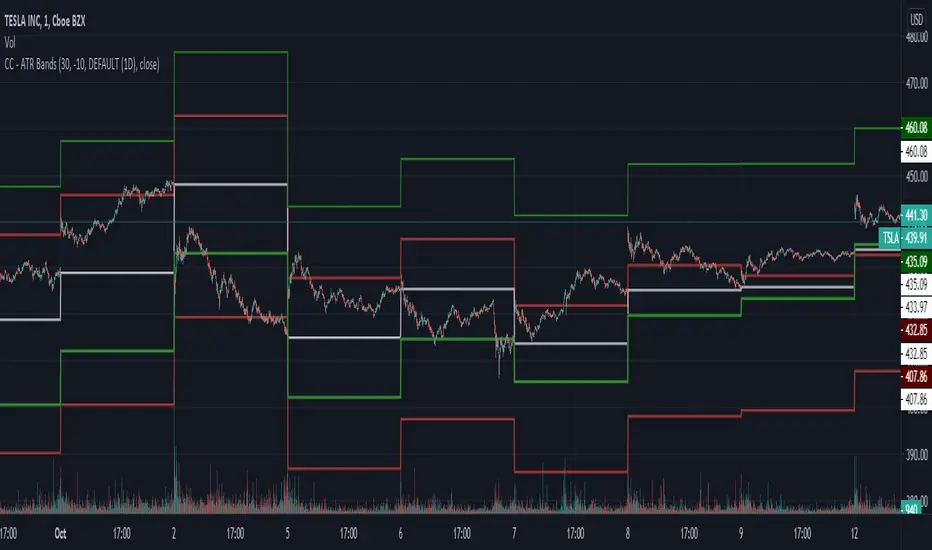
Plots ATR bands around candles at any HTF resolution you desire, taken in through the inputs. The white line represents the open of the HTF, the red and green the expected boundaries. You can use the risk tolerance slider up/down to adjust how risky you want to be with the ATR bands.
I am not responsible for outcomes using this method, indicator or anything else. Please do your own due diligence.
I am not responsible for outcomes using this method, indicator or anything else. Please do your own due diligence.
受保护脚本
此脚本以闭源形式发布。 但是,您可以自由使用,没有任何限制 — 了解更多信息这里。
All of these scripts are sponsored by NChart, as he has graciously given me money for trading view premium to help me develop scripts! Check my bio for more information and a link to their twitter. Mods if this is not okay DM me, thanks! Apologies.
免责声明
这些信息和出版物并非旨在提供,也不构成TradingView提供或认可的任何形式的财务、投资、交易或其他类型的建议或推荐。请阅读使用条款了解更多信息。