OPEN-SOURCE SCRIPT
已更新 DMI Toolbox Strategy

The Directional Movement Index (DMI) was originally developed by J. Welles Wilder Jr. in 1978. Wilder introduced the DMI along with the Average Directional Index (ADX) in his book, “New Concepts in Technical Trading Systems,” which became a foundational reference for technical analysis.
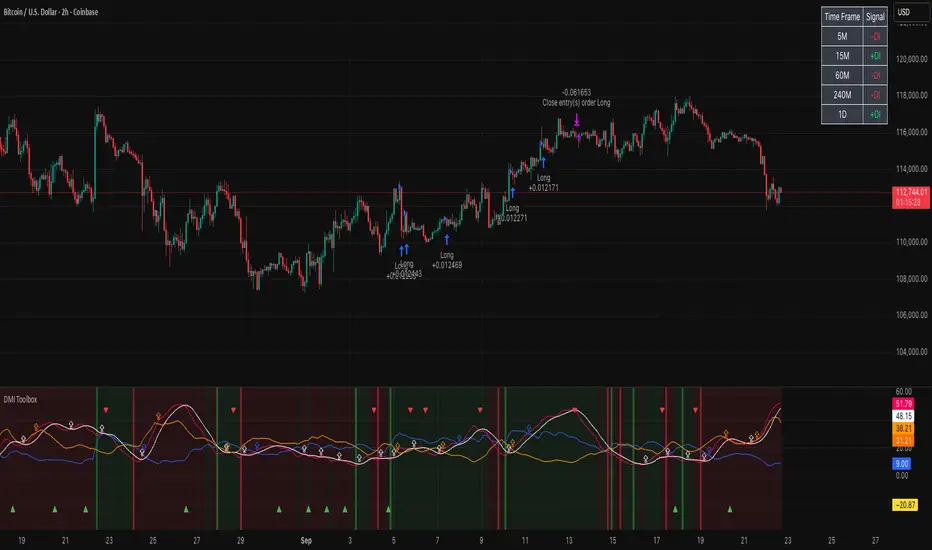
The indicator can offer a myriad of signals for building a trading strategy. In an effort to provide the user with a meaningful way to evaluate these signals, this DMI Toolbox Strategy offers the chance to back-test various combinations and permutations of DMI signals on long trades. By default it will open a long position on the +DI (upward movement) crossing above the -DI (downward movement). By default, It exits long positions when the ADX (trend strength) reverses.
Suggested Use
Try a wide variety of long entry and exit signals across many different timeframes to see what is most effective for the item you wish to trade. There is a table in the upper right corner that will give a quick view of which signal is dominant across 5 timeframes, based on your current settings. Adjust the pyramidding, slippage, and commission values to more closely match your situation.
Visual Helpers
The DMI indicator has been altered to include a smoothed version of the ADX, as well as a colored background to show which signal is dominant (+DI or -DI). Small up arrows call your attention to ADX crossovers that may indicate a significant threshold in trend strength.
版本注释
- Cleaned up some of the descriptions in the inputs menu to be easier to understand- Added more tooltips in the inputs menu to help explain what the settings do
- Changed the default order size to 33% since the default pyramiding is 3
- Users are encouraged to alter the order size and pyramiding to their needs
- Adjusting these values is important, especially if you don't see long entries showing up where you think they should
版本注释
This update includes changes to the default settings to make the strategy more realistic in terms of slippage, commission, and percentage of equity. The new chart image shows the BTCUSD cryptocurrency pair under the default strategy settings on the 2H timeframe. We chose these defaults as an example to start off with. But the purpose of the DMI Toolbox is exploration of the many ways in which the DMI might be used to find entries and exits across a wide range of stocks and cryptocurrency. Traders are encouraged to try these settings, and make adjustments based on the timeframe and symbols that you intend to trade. For example, ADX settings should be adjusted to match the volatility of the item you are trading.Some of the descriptive text in this update has been edited to make the settings easier to understand. Specifically, the custom pattern "ADX Breakout Pattern" has been renamed "ADX Sustained Momentum Signal". The reason for this name stems from observations that a particular DMI plot pattern is commonly associated with strong rallies in price, or "pumps". The pattern is identified when the ADX rises sharply upward through it's moving average, then upward through the -DI, and ultimately upward through the +DI. As ADX represents trend strength, it is not unusual that this pattern often coincides with strong moves up in price. You will want to backtest this to see how it performs in various timeframes and trading symbols.
Here is an example of the DMI pattern we are calling "ADX Sustained Momentum Signal":
版本注释
This update contains a couple of small bug fixes and cleans up the input menu a bit. There are four choices that are now labeled "Mandatory Requirements for a Long". This means that if you check the box for any one of these, they must evaluate "true" or none of the DMI options will trigger a long entry. These include:"Require Bullish +DI above -DI Signal"
- and the corresponding max number of candles for an entry signal once this is true
"Price is below the 21 Period Moving Average"
"Price is above its 200 Period Moving Average"
"Volume is above its 21 Period Moving Average"
开源脚本
秉承TradingView的精神,该脚本的作者将其开源,以便交易者可以查看和验证其功能。向作者致敬!您可以免费使用该脚本,但请记住,重新发布代码须遵守我们的网站规则。
See my YouTube channel for videos explaining some of the strategies that I post.
免责声明
这些信息和出版物并非旨在提供,也不构成TradingView提供或认可的任何形式的财务、投资、交易或其他类型的建议或推荐。请阅读使用条款了解更多信息。
开源脚本
秉承TradingView的精神,该脚本的作者将其开源,以便交易者可以查看和验证其功能。向作者致敬!您可以免费使用该脚本,但请记住,重新发布代码须遵守我们的网站规则。
See my YouTube channel for videos explaining some of the strategies that I post.
免责声明
这些信息和出版物并非旨在提供,也不构成TradingView提供或认可的任何形式的财务、投资、交易或其他类型的建议或推荐。请阅读使用条款了解更多信息。