OPEN-SOURCE SCRIPT
已更新 Block-Based Trend Breakout (YTK/DTK) – v1
📌 Overview
Block Trend Breakout (YTK/DTK) is a lightweight, rule-based indicator that detects potential trend reversals or volatility bursts by tracking breakouts of key structural support/resistance levels — derived from block-wise trend patterns.
The logic is simple yet effective: if a trend has been confirmed across multiple blocks (custom-length bar groups), and the price breaks its own structural boundary, a potential reversal or volatility signal is triggered.
🟥 YTK (Uptrend Breakdown) → Price breaks below the lowest low of the most recent block in an uptrend.
🟩 DTK (Downtrend Breakout) → Price breaks above the highest high of the most recent block in a downtrend.
🔍 How It Works
Block Construction: User-defined bar groups (e.g., 6 bars on a 4H chart = 24H blocks).
Trend Validation: At least N consecutive blocks must show higher highs/lows (uptrend) or lower highs/lows (downtrend).
Breakout Test: If the current bar violates the structural limit (MR block high/low), the corresponding signal is plotted.
📉 This logic identifies weakening trends or failed momentum, often preceding reversals or volatility expansions.
⚙️ Features
Adjustable block size and trend confirmation count
Option to use only closed bars (to reduce repaint risk)
Inclusive mode for “<= / >=” logic
Visual signals:
MR Block high/low levels
Trend-colored bars
Arrows for YTK (🔻) and DTK (🔺)
Built-in alerts for automated strategies
🎯 Use Cases
Spotting fakeouts and false breakouts
Identifying trend exhaustion before reversal
Confirming structural support/resistance breaks
Visual tool for discretionary traders
Signal generator for automated systems
💬 Feedback & Contributions
This script is open-source and community-driven. We actively welcome feedback, ideas, improvements, forks, and questions.
📩 Contact for collaboration or discussion:
📧 senbrke@gmail.com
版本注释
📌 Overview📉 This logic identifies weakening trends or failed momentum, often preceding reversals or volatility expansions.
Block Trend Breakout (YTK/DTK) is a lightweight, rule-based indicator that detects potential trend reversals or volatility bursts by tracking breakouts of key structural support/resistance levels — derived from block-wise trend patterns.
The logic is simple yet effective: if a trend has been confirmed across multiple blocks (custom-length bar groups), and the price breaks its own structural boundary, a potential reversal or volatility signal is triggered.
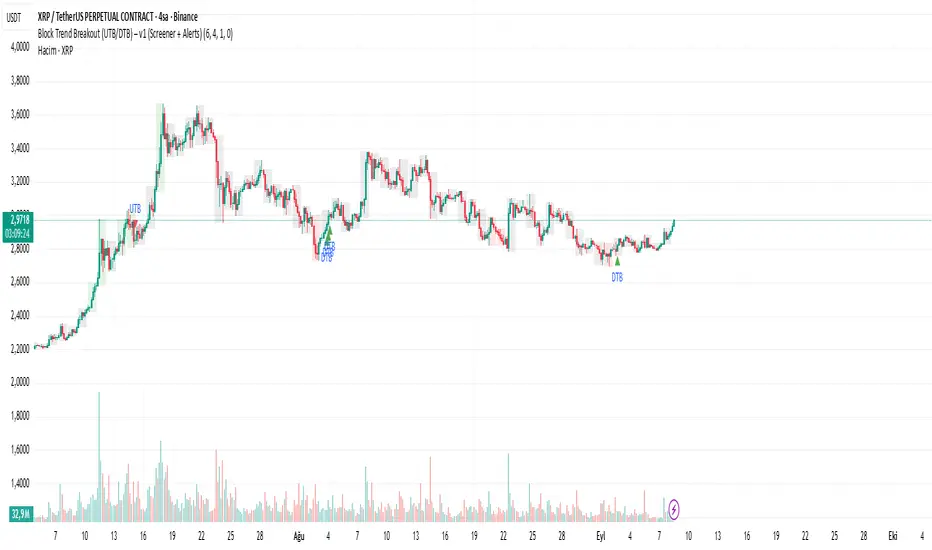
🟥 UTB (Uptrend Breakdown) → Price breaks below the lowest low of the most recent block in an uptrend.
🟩 DTB (Downtrend Breakout) → Price breaks above the highest high of the most recent block in a downtrend.
🔍 How It Works
- Block Construction: User-defined bar groups (e.g., 6 bars on a 4H chart = 24H blocks).
- Trend Validation: At least N consecutive blocks must show higher highs/lows (uptrend) or lower highs/lows (downtrend).
- Breakout Test: If the current bar violates the structural limit (MR block high/low), the corresponding signal is plotted.
⚙️ Features
- Adjustable block size and trend confirmation count
- Option to use only closed bars (to reduce repaint risk)
- Inclusive mode for “<= / >=” logic
Visual signals:
- MR Block high/low levels
- Trend-colored bars
- Arrows for UTB (🔻) and DTB (🔺)
- Built-in alerts for automated strategies
🎯 Use Cases
- Spotting fakeouts and false breakouts
- Identifying trend exhaustion before reversal
- Confirming structural support/resistance breaks
- Visual tool for discretionary traders
- Signal generator for automated systems
💬 Feedback & Contributions
This script is open-source and community-driven. We actively welcome feedback, ideas, improvements, forks, and questions.
📩 Contact for collaboration or discussion:
📧 senbrke@gmail.com
版本注释
This is an updated version of the indicator. The following changes have been made to its functionality and visual analysis.Functional Changes & New Capabilities
1. More Flexible Trend Definition
The logic for trend detection has been updated for better performance in noisy market conditions.
Tolerance for Off-Trend Steps (tolExceptions): A new input has been added to allow for a set number of "off-trend" blocks before a trend is invalidated. The previous version would break the trend on the first contradictory block.
Soft Inequality (epsPct): This input adds a small percentage-based tolerance to comparisons. It helps maintain trend continuity when block highs or lows are nearly equal.
2. Screener Compatibility
The indicator is now compatible with the TradingView Screener. It plots the UTB (Uptrend Breakout) and DTB (Downtrend Breakout) signals in the background, allowing you to scan for these events across multiple markets. This feature was not available in the previous version.
Visual Changes
Trend Block Visualization (showBoxes)
A new visual feature has been added to draw colored boxes over the blocks that constitute a confirmed trend (green for uptrends, red for downtrends). This offers a clearer visual guide to the trend structure being analyzed. This can be enabled or disabled via the showBoxes input in the settings.
开源脚本
本着TradingView的真正精神,此脚本的创建者将其开源,以便交易者可以查看和验证其功能。向作者致敬!虽然您可以免费使用它,但请记住,重新发布代码必须遵守我们的网站规则。
免责声明
这些信息和出版物并不意味着也不构成TradingView提供或认可的金融、投资、交易或其它类型的建议或背书。请在使用条款阅读更多信息。
免责声明
这些信息和出版物并不意味着也不构成TradingView提供或认可的金融、投资、交易或其它类型的建议或背书。请在使用条款阅读更多信息。