PROTECTED SOURCE SCRIPT
GG [AYC]
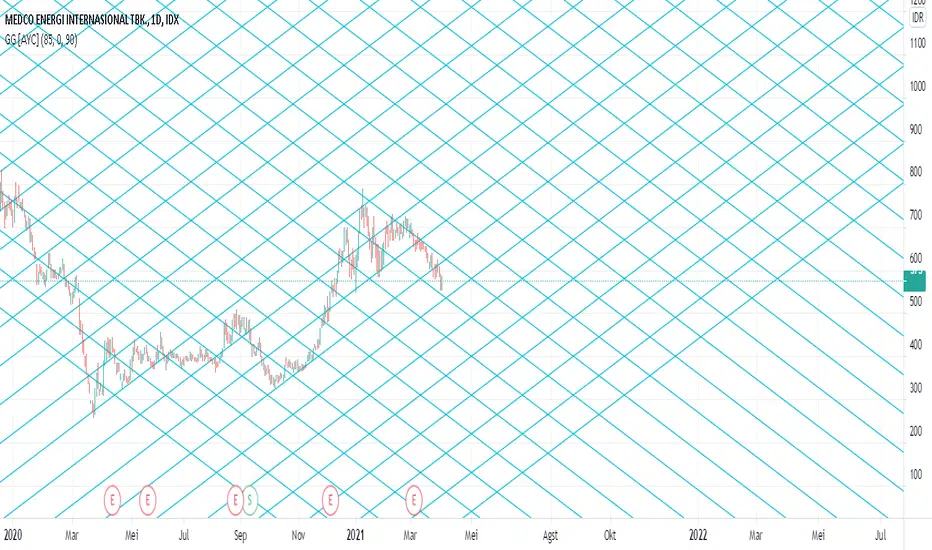
This indicator basically works like Gann Grid indicator that can be used as an SNR , making it easier to draw diagonal lines with the same price difference for each line.
The change in SNR in a market can be in the form of a certain gap/point number according to its characteristics.
Entering these numbers can make it easier for traders to determine SNR for better profit.
How to use :
1.Enter "Price" (Extreme Low)
2.Enter "Price Step" (It doesn't really important, just in case the line is not enough, because tradingview has limitations in plotting lines), Default is "0" & Step is "270"
3.Enter "Point" that you want as SNR , 90 is the default for the stock market.
4.Choose "Start"
Start = The start date of the cycle of price movements
5.Choose "End"
End = The end date of the cycle of price movements
受保护脚本
此脚本以闭源形式发布。 但是,您可以自由使用,没有任何限制 — 了解更多信息这里。
免责声明
这些信息和出版物并非旨在提供,也不构成TradingView提供或认可的任何形式的财务、投资、交易或其他类型的建议或推荐。请阅读使用条款了解更多信息。
受保护脚本
此脚本以闭源形式发布。 但是,您可以自由使用,没有任何限制 — 了解更多信息这里。
免责声明
这些信息和出版物并非旨在提供,也不构成TradingView提供或认可的任何形式的财务、投资、交易或其他类型的建议或推荐。请阅读使用条款了解更多信息。