PROTECTED SOURCE SCRIPT
Buy On Dip
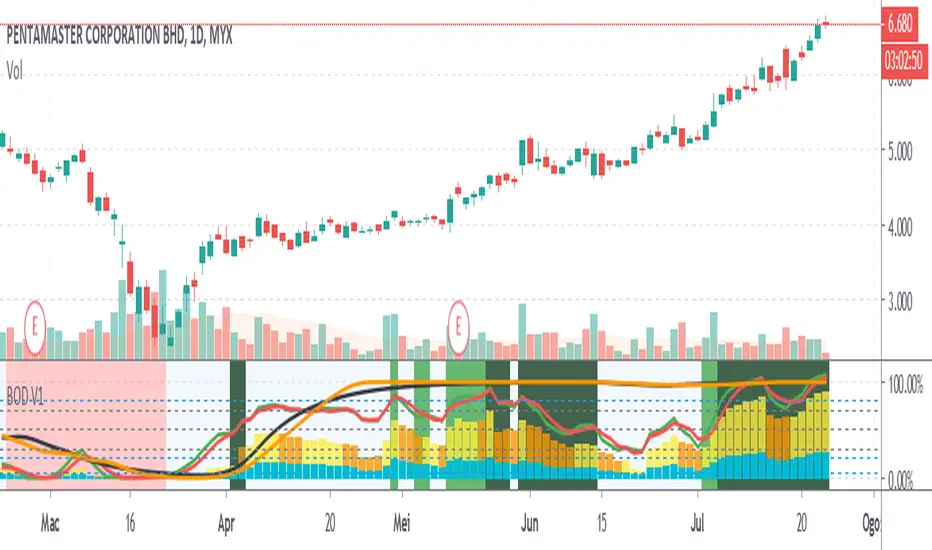
This Setup Show When To Buy On Dip. (not 100% working, just as guidance)
The idea is combined from other script (thanks to all scriptwriter) and modified by me.
Main Idea Line and Histogram are derived and modified by:
1. Stochastic RSI ( red and green)
2. Ema/Sma ( Black and orange)
how to interpret same as default Stochastic Rsi.
For Histogram:
If Blue above line 5%, Bullish indicator and;
If Yellow appear stronger the Bullish Sign,
If No bar above blue histogram, it indicate sideway and want to go bearish.
If Orange bar appear show the bullish is weak.
Entry when the back ground is not red.
Buy on Dip entry when the blue and yellow histogram color just appear. (not 100% working, just as guidance)
The darker the background color mean the strong uptrend.
Tested At Stock Market Bursa Malaysia, maybe can use at FOREX.
受保护脚本
此脚本以闭源形式发布。 但是,您可以自由使用,没有任何限制 — 了解更多信息这里。
免责声明
这些信息和出版物并非旨在提供,也不构成TradingView提供或认可的任何形式的财务、投资、交易或其他类型的建议或推荐。请阅读使用条款了解更多信息。
免责声明
这些信息和出版物并非旨在提供,也不构成TradingView提供或认可的任何形式的财务、投资、交易或其他类型的建议或推荐。请阅读使用条款了解更多信息。