OPEN-SOURCE SCRIPT
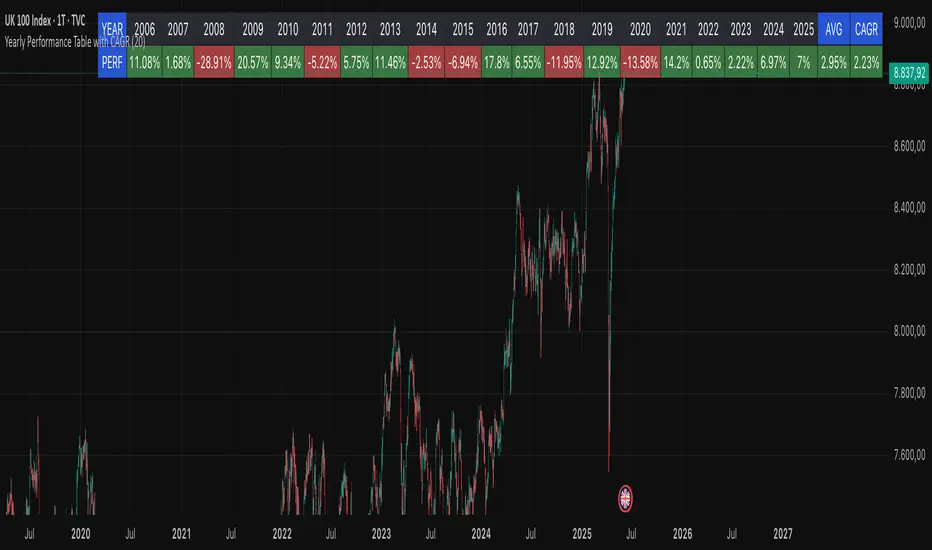
Yearly Performance Table with CAGR
Overview
This Pine Script indicator provides a clear table displaying the annual performance of an asset, along with two different average metrics: the arithmetic mean and the geometric mean (CAGR).
Core Features
Annual Performance Calculation:
Automatically detects the first trading day of each calendar year.
Calculates the percentage return for each full calendar year.
Based on closing prices from the first to the last trading day of the respective year.
Flexible Display:
Adjustable Period: Displays data for 1-50 years (default: 10 years).
Daily Timeframe Only: Functions exclusively on daily charts.
Automatic Update: Always shows the latest available years.
Two Average Metrics:
AVG (Arithmetic Mean)
A simple average of all annual returns. (Formula: (R₁ + R₂ + ... + Rₙ) ÷ n)
Important: Can be misleading in the presence of volatile returns.
GEO (Geometric Mean / CAGR)
Compound Annual Growth Rate. (Formula: [(1+R₁) × (1+R₂) × ... × (1+Rₙ)]^(1/n) - 1)
Represents the true average annual growth rate.
Fully accounts for the compounding effect.
Limitations
Daily Charts Only: Does not work on intraday or weekly/monthly timeframes.
Calendar Year Basis: Calculations are based on calendar years, not rolling 12-month periods.
Historical Data: Dependent on the availability of historical data from the broker/data provider.
Interpretation of Results
CAGR as Benchmark: The geometric mean is more suitable for performance comparisons.
Annual Patterns: Individual year figures can reveal seasonal or cyclical trends.
开源脚本
秉承TradingView的精神,该脚本的作者将其开源,以便交易者可以查看和验证其功能。向作者致敬!您可以免费使用该脚本,但请记住,重新发布代码须遵守我们的网站规则。
免责声明
这些信息和出版物并非旨在提供,也不构成TradingView提供或认可的任何形式的财务、投资、交易或其他类型的建议或推荐。请阅读使用条款了解更多信息。
免责声明
这些信息和出版物并非旨在提供,也不构成TradingView提供或认可的任何形式的财务、投资、交易或其他类型的建议或推荐。请阅读使用条款了解更多信息。