PROTECTED SOURCE SCRIPT
Red Dog Reversal Pattern
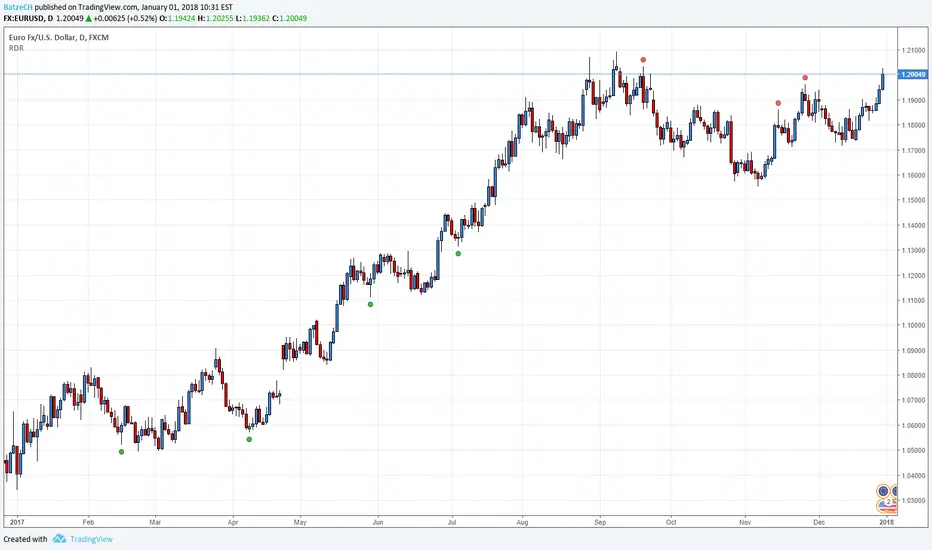
This indicator is a interpretation of the Red Dog Reversal Pattern which was discovered by T3Live founder Scott Redler. (AFAIK)
The indicator is maybe useful for Day Trade or Swing Trade.
BUY Criteria:
1. Stock is down for multiple days
2. Stock goes below prior day's low
3. Stock trades back up through prior day's low, which triggers the buy
4. The stop is set at the current intraday low
SELL Criteria:
1. Stock is up for multiple days
2. Stock goes above the prior day's high
3. Stock trades back down through prior day's high, which triggers the sell
4. The stop is set at the current intraday high
Please always remember, there is no holy grail indicator!
受保护脚本
此脚本以闭源形式发布。 但是,您可以自由使用,没有任何限制 — 了解更多信息这里。
免责声明
这些信息和出版物并非旨在提供,也不构成TradingView提供或认可的任何形式的财务、投资、交易或其他类型的建议或推荐。请阅读使用条款了解更多信息。
免责声明
这些信息和出版物并非旨在提供,也不构成TradingView提供或认可的任何形式的财务、投资、交易或其他类型的建议或推荐。请阅读使用条款了解更多信息。