OPEN-SOURCE SCRIPT
已更新 Gann Square
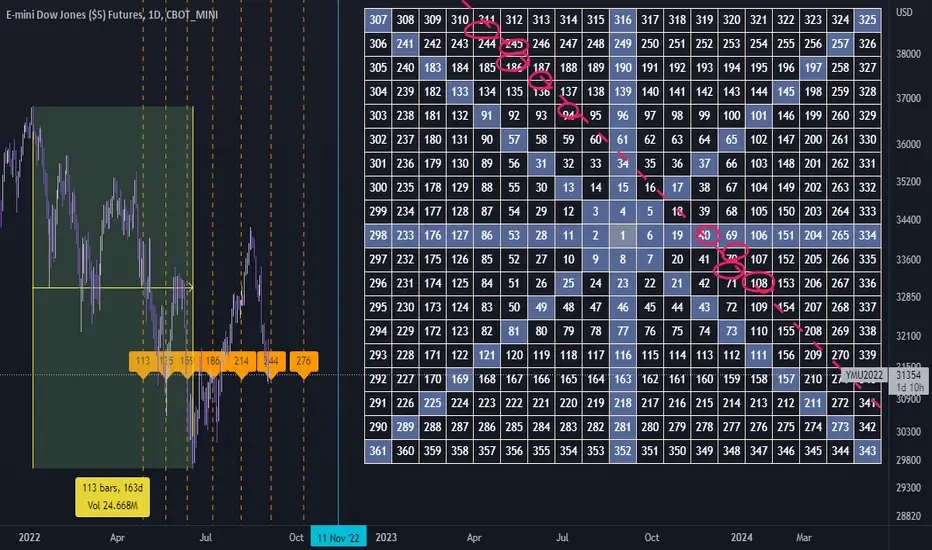
This indicator build by Gann Square of 19.
you select start and end of big trend in daily timeframe and calculate date range.
by draw trend line in Gann square and enter the numbers cross by line in settings input you could recognize future pivot points
remember : first) this tool worked only in daily timeframe. second) better using this in dark theme :)
chart example :
版本注释
Add color changing options for traders who like light theme开源脚本
秉承TradingView的精神,该脚本的作者将其开源,以便交易者可以查看和验证其功能。向作者致敬!您可以免费使用该脚本,但请记住,重新发布代码须遵守我们的网站规则。
免责声明
这些信息和出版物并非旨在提供,也不构成TradingView提供或认可的任何形式的财务、投资、交易或其他类型的建议或推荐。请阅读使用条款了解更多信息。
开源脚本
秉承TradingView的精神,该脚本的作者将其开源,以便交易者可以查看和验证其功能。向作者致敬!您可以免费使用该脚本,但请记住,重新发布代码须遵守我们的网站规则。
免责声明
这些信息和出版物并非旨在提供,也不构成TradingView提供或认可的任何形式的财务、投资、交易或其他类型的建议或推荐。请阅读使用条款了解更多信息。