OPEN-SOURCE SCRIPT
HT: Weekly Levels
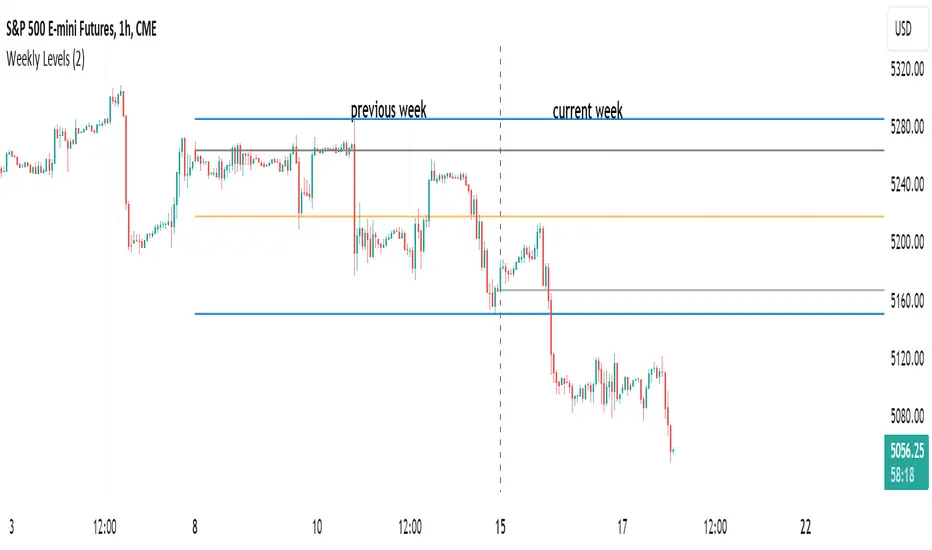
Indicator draws several most important weekly levels on the lower timeframe: last week high/low, halfback, week close and current week open. These levels often act as support/resistance for price movements. Also, they can help to assess week character and control of power.
Indicator can be used on any timeframe, lower than weekly, for any type of instrument, including futures. It also provides an option to draw levels for any selected week back in time.
Important notes:
• Levels for the last week are drawn after the new week opens.
• Half-back is calculated as a middle line between week High and Low.
Parameters:
Date – user can select date, belonging to week, for which levels will be plotted. Works only if “Use” check box is on. Otherwise, levels will be plotted for the last week. (“time” value doesn’t matter; unfortunately, there is no way to hide the input box)
Time zone – your chart time zone (as UTC offset). Only needed if you use “Date” parameter.
Visuals – controls visibility and colors
Script is published as an open source. It uses two libraries: Levels Lib and Functions Lib. First one demonstrates how to work with pine-script object model and arrays. You can also reuse it in your custom scripts where there is need to construct any support/resistance levels. The second library contains some useful functions for working with time and dates.
Disclaimer
This indicator should not be used as a standalone tool to make trading decisions but only in conjunction with other technical analysis methods.
开源脚本
秉承TradingView的精神,该脚本的作者将其开源,以便交易者可以查看和验证其功能。向作者致敬!您可以免费使用该脚本,但请记住,重新发布代码须遵守我们的网站规则。
免责声明
这些信息和出版物并非旨在提供,也不构成TradingView提供或认可的任何形式的财务、投资、交易或其他类型的建议或推荐。请阅读使用条款了解更多信息。
开源脚本
秉承TradingView的精神,该脚本的作者将其开源,以便交易者可以查看和验证其功能。向作者致敬!您可以免费使用该脚本,但请记住,重新发布代码须遵守我们的网站规则。
免责声明
这些信息和出版物并非旨在提供,也不构成TradingView提供或认可的任何形式的财务、投资、交易或其他类型的建议或推荐。请阅读使用条款了解更多信息。