OPEN-SOURCE SCRIPT
Major & Modern Wars Timeline
Description:
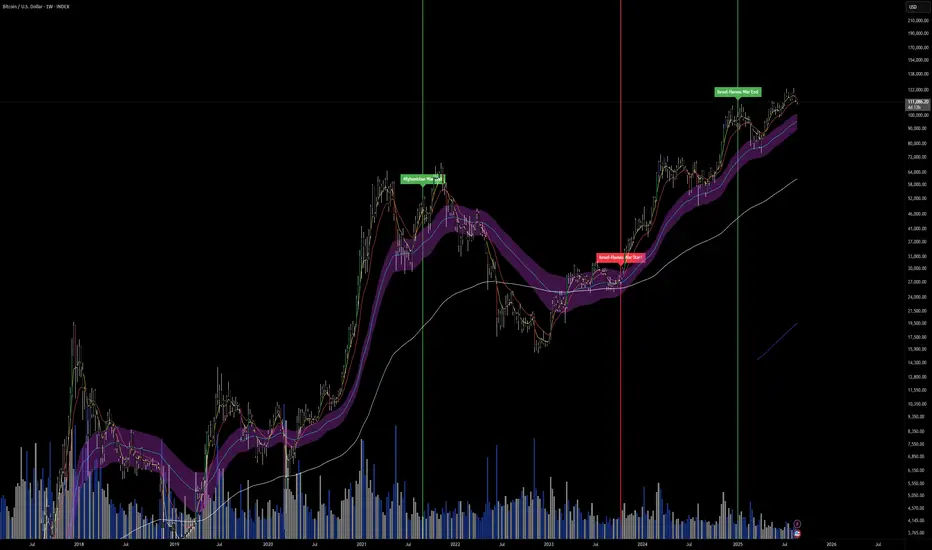
This indicator overlays vertical lines and labels on your chart to mark the start and end dates of major global wars and modern conflicts.
Features:
Displays start (red line + label) and end (green line + label) for each war.
Covers 20th century wars (World War I, World War II, Korean War, Vietnam War, Gulf War, Afghanistan, Iraq).
Includes modern conflicts: Syrian Civil War, Ukraine War, and Israel–Hamas War.
For ongoing conflicts, the end date is set to 2025 for timeline visualization.
Customizable: label position (above/below bar), line width.
Works on any chart timeframe, overlaying events on financial data.
Use case:
Useful for historical market analysis (e.g., gold, oil, S&P 500), helping traders and researchers see how wars and conflicts align with market movements.
开源脚本
秉承TradingView的精神,该脚本的作者将其开源,以便交易者可以查看和验证其功能。向作者致敬!您可以免费使用该脚本,但请记住,重新发布代码须遵守我们的网站规则。
免责声明
这些信息和出版物并非旨在提供,也不构成TradingView提供或认可的任何形式的财务、投资、交易或其他类型的建议或推荐。请阅读使用条款了解更多信息。
开源脚本
秉承TradingView的精神,该脚本的作者将其开源,以便交易者可以查看和验证其功能。向作者致敬!您可以免费使用该脚本,但请记住,重新发布代码须遵守我们的网站规则。
免责声明
这些信息和出版物并非旨在提供,也不构成TradingView提供或认可的任何形式的财务、投资、交易或其他类型的建议或推荐。请阅读使用条款了解更多信息。