PROTECTED SOURCE SCRIPT
已更新 Rs Candlestick Indicator With Moving Averages
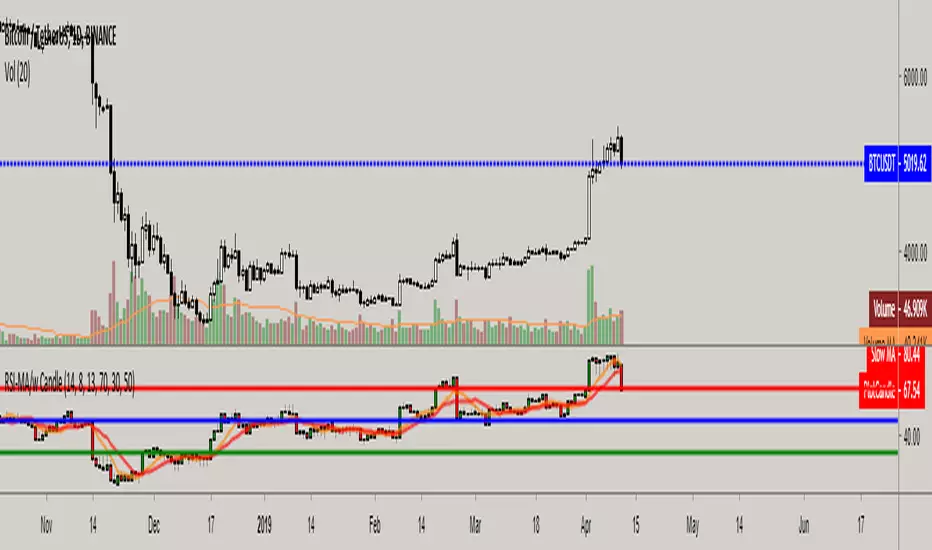
Unlike the traditional RSI, this one offers you an detailed insight with candlestick chart, rather than a simple line setup. It also includes two different customizable moving average(s) and offers detailed information such as bullish/bearish candlestick formations, negative and positive divergences on indicator.
How to use: Similar to candlestick charts, whenever Rsi candle close and stays above moving average(s) it's a buy signal and whenever candle closes below moving average(s), that's a sell signal. Rather than waiting for Rsi to break mid-line(50) to buy and sell, this one offers dynamic and more accurate buy and sell signals. You can also customize top-mid-bottom line values as well to determine overbought and oversold levels.
How to use: Similar to candlestick charts, whenever Rsi candle close and stays above moving average(s) it's a buy signal and whenever candle closes below moving average(s), that's a sell signal. Rather than waiting for Rsi to break mid-line(50) to buy and sell, this one offers dynamic and more accurate buy and sell signals. You can also customize top-mid-bottom line values as well to determine overbought and oversold levels.
版本注释
Added mid-line color.受保护脚本
此脚本以闭源形式发布。 但是,您可以自由使用,没有任何限制 — 了解更多信息这里。
免责声明
这些信息和出版物并非旨在提供,也不构成TradingView提供或认可的任何形式的财务、投资、交易或其他类型的建议或推荐。请阅读使用条款了解更多信息。
免责声明
这些信息和出版物并非旨在提供,也不构成TradingView提供或认可的任何形式的财务、投资、交易或其他类型的建议或推荐。请阅读使用条款了解更多信息。