INVITE-ONLY SCRIPT
已更新 Support and Resistance Intensity Zones
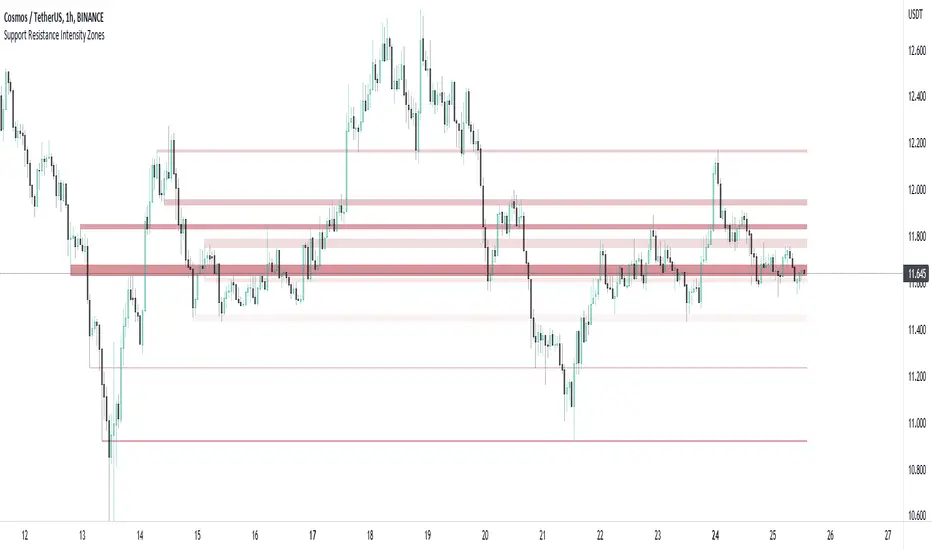
Support and resistance are often drawn using lines. This is too simple and doesn't give a clear idea of the market sentiment at these particular levels. What is strong support and resistance? What is weak support and resistance. How can either be defined by a single price point?
Using a simple, clean and configurable solution, this indicator not only shows these support and resistance levels as zones, it also gives them a colour gradient based on their intensity.
It does this by letting you choose the pivot highs and lows within a chosen range back. Then you choose one of two options to display how these multiple pivots at the same levels look. You can either group these pivots together into 'zones', where grouped pivots are all separated by a chosen price percentage, choosing how many zones to display, the most grouped pivots being the most intense colour.
Alternatively you display the pivots by 'gradient', where the closer the pivots are together in price the more intense the colour. As pivots diverge apart, the colour weakens.
Both of these options have to be seen to realise how much more there is to support and resistance than a single line.
版本注释
Fixed some elements of the Zones option.版本注释
Fixed a bug in displaying the Gradient type S/R zones版本注释
Changed some of the default settings so the indicator is more useful when first applied.Changed the default colours so the indicator works well on both light and dark theme charts, when first applied.
Added some more helpful tooltips.
版本注释
Option to extended the boxes drawings into the future, on by default.Additional tooltip warning - if there is an error, reduce the number of zones being used, there are not enough pivots for the required zones.
仅限邀请脚本
只有作者授权的用户才能访问此脚本。您需要申请并获得使用许可。通常情况下,付款后即可获得许可。更多详情,请按照下方作者的说明操作,或直接联系Texmoonbeam。
TradingView不建议您付费购买或使用任何脚本,除非您完全信任其作者并了解其工作原理。您也可以在我们的社区脚本找到免费的开源替代方案。
作者的说明
Please message me to gain access, full details can be found here: https://texmoonbeam.notion.site/texmoonbeam/TradingView-Indicators-by-Texmoonbeam-9f09de3020864ff6a786004af3ba2488
Contact me directly on TradingView or Twitter for queries, for purchasing and indicator guides please check here texmoonbeam.notion.site/TradingView-Indicators-by-Texmoonbeam-9f09de3020864ff6a786004af3ba2488
免责声明
这些信息和出版物并非旨在提供,也不构成TradingView提供或认可的任何形式的财务、投资、交易或其他类型的建议或推荐。请阅读使用条款了解更多信息。