OPEN-SOURCE SCRIPT
Spread Rebalance Simulation
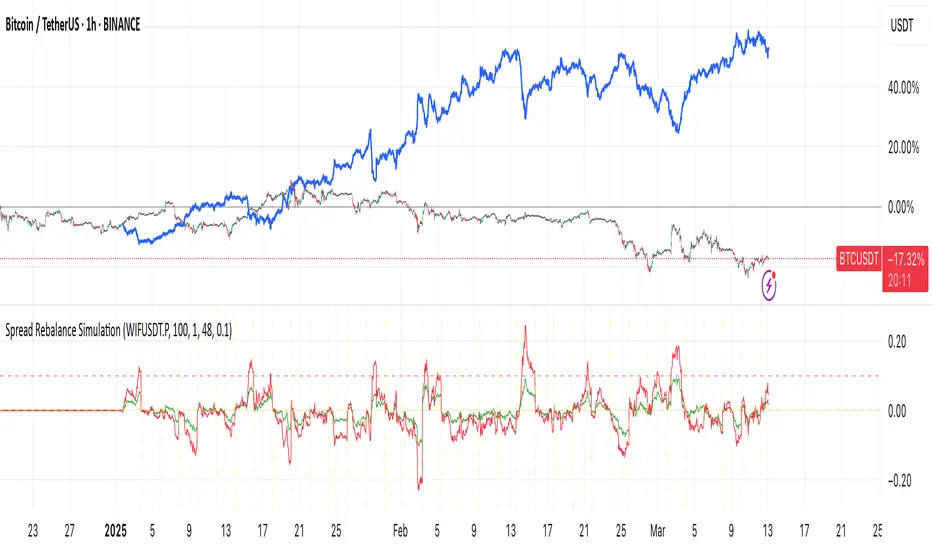
The Spread Rebalance Simulator is a tool designed to help visualize the effect of rebalancing on spread trading returns. Typically, TradingView charts are used to display spread charts, but this method assumes that the ratio remains unchanged on each bar. In real trading scenarios, the ratio constantly changes, and this indicator allows traders to see a more accurate representation of spread trading.
The next version will include support for input ratio and trading cost.
To use this simply select any chart (as a long pair) then fill the symbol name for the short pair. Then choose the rebalance period. The blue line will show you the equity of this pair combination.
The next version will include support for input ratio and trading cost.
To use this simply select any chart (as a long pair) then fill the symbol name for the short pair. Then choose the rebalance period. The blue line will show you the equity of this pair combination.
开源脚本
秉承TradingView的精神,该脚本的作者将其开源,以便交易者可以查看和验证其功能。向作者致敬!您可以免费使用该脚本,但请记住,重新发布代码须遵守我们的网站规则。
免责声明
这些信息和出版物并非旨在提供,也不构成TradingView提供或认可的任何形式的财务、投资、交易或其他类型的建议或推荐。请阅读使用条款了解更多信息。
开源脚本
秉承TradingView的精神,该脚本的作者将其开源,以便交易者可以查看和验证其功能。向作者致敬!您可以免费使用该脚本,但请记住,重新发布代码须遵守我们的网站规则。
免责声明
这些信息和出版物并非旨在提供,也不构成TradingView提供或认可的任何形式的财务、投资、交易或其他类型的建议或推荐。请阅读使用条款了解更多信息。