OPEN-SOURCE SCRIPT
Volume 15m vs 1m
*Up/Down Volume Indicator
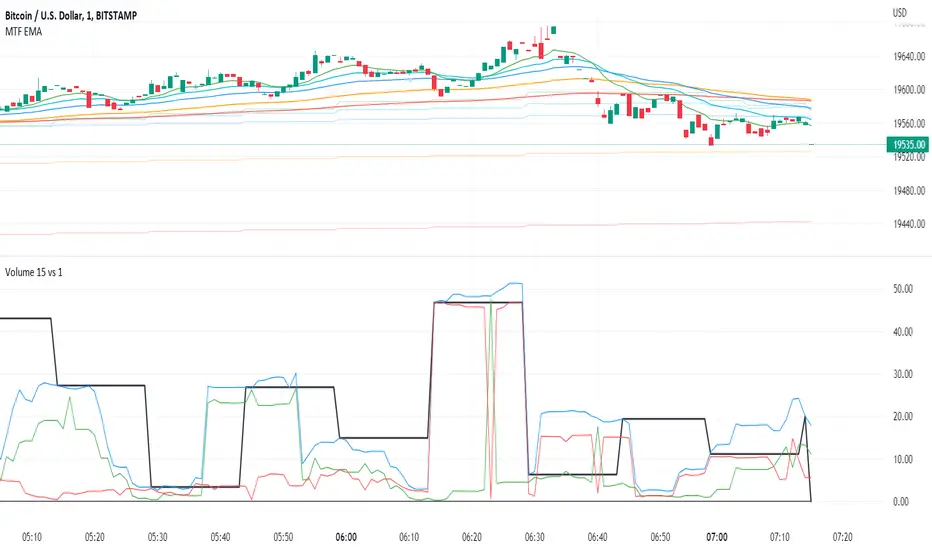
This indicator plots the 15m volume (black line) on the 1m chart alongside the sum of 1m volume for 15m (blue line).
This indicator allows us to see the raw data that will generate the 15m volume before it occurs.
Next it seperates up period volume (green line) from down period volume (red line) so that we can see how much of each was responsible for the total volume.
The black line will dance for 15m at a time but if the blue line rises above the locked in section of the black line (to the left), then the next 15m volume will be higher than the last.
Also, if the green line is higher than the red, we know that up volume is driving of the increase.
*Volume Sum Indicator
This indicator allows us to track the volume trend even when volume is near zero.
This indicators sums the 15m volume for 13 periods to represent 200 minutes worth of volume.
Then it plots the sum of 1m up volume for 200 periods and the 1m down volume for 200 periods.
When green is over red, the volume is trending up.
Blue is the total 1m volume for 200 periods. It should act as a resistance line since it is unusual for 100% of volume to be up volume or down volume.
This indicator only works on the 1m chart. The higher timeframe must be set to 15m. If anyone knows how to make this indicator work on any timeframe that would be great!
开源脚本
秉承TradingView的精神,该脚本的作者将其开源,以便交易者可以查看和验证其功能。向作者致敬!您可以免费使用该脚本,但请记住,重新发布代码须遵守我们的网站规则。
免责声明
这些信息和出版物并非旨在提供,也不构成TradingView提供或认可的任何形式的财务、投资、交易或其他类型的建议或推荐。请阅读使用条款了解更多信息。
开源脚本
秉承TradingView的精神,该脚本的作者将其开源,以便交易者可以查看和验证其功能。向作者致敬!您可以免费使用该脚本,但请记住,重新发布代码须遵守我们的网站规则。
免责声明
这些信息和出版物并非旨在提供,也不构成TradingView提供或认可的任何形式的财务、投资、交易或其他类型的建议或推荐。请阅读使用条款了解更多信息。