OPEN-SOURCE SCRIPT
已更新 Dynamic Intraday HLC levels [Sudeb]
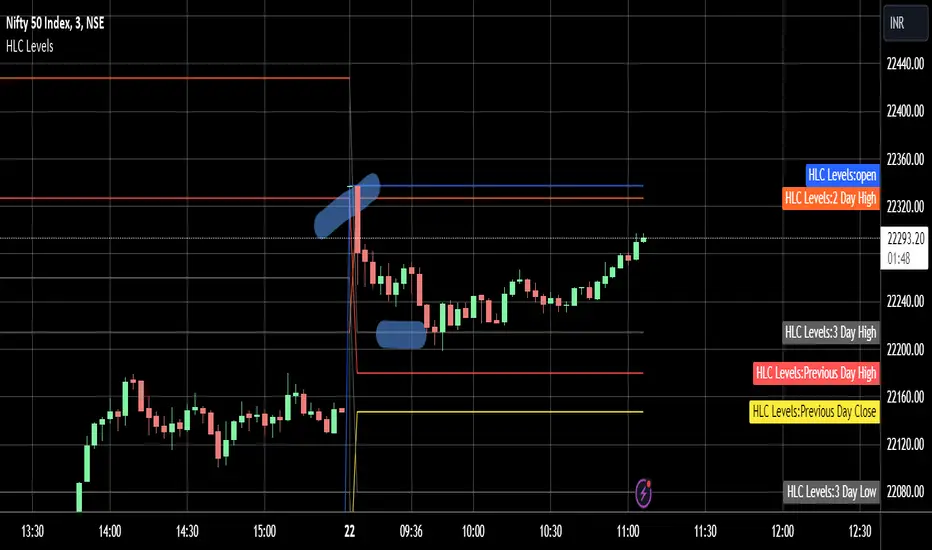
This is a simple indicator which will mark High & Low of last three days.
Close of Previous Day
The High lines will show in RED color, Low lines in green & close lines in Yellow.
The advantage of using this indicator is - It will greyed out or fade the color of any previous day level if the price is breached of that level.
For example if 2 day's ago High price is breached by 1 day's ago High, then the 2 Day's ago High level color will greyed out in current day chart. Thus giving you a confirmation whether it's a fresh or already tested levels.
版本注释
Few code modifications have been made. 版本注释
Few code updates have been made. 开源脚本
秉承TradingView的精神,该脚本的作者将其开源,以便交易者可以查看和验证其功能。向作者致敬!您可以免费使用该脚本,但请记住,重新发布代码须遵守我们的网站规则。
免责声明
这些信息和出版物并非旨在提供,也不构成TradingView提供或认可的任何形式的财务、投资、交易或其他类型的建议或推荐。请阅读使用条款了解更多信息。
开源脚本
秉承TradingView的精神,该脚本的作者将其开源,以便交易者可以查看和验证其功能。向作者致敬!您可以免费使用该脚本,但请记住,重新发布代码须遵守我们的网站规则。
免责声明
这些信息和出版物并非旨在提供,也不构成TradingView提供或认可的任何形式的财务、投资、交易或其他类型的建议或推荐。请阅读使用条款了解更多信息。