INVITE-ONLY SCRIPT
已更新 CandelaCharts - Mean Reversion Oscillator
📝 Overview
The Mean Reversion Oscillator (MRO) is a bounded 0–100 indicator that shows how far the price has deviated from its statistical mean. Normalizing deviations into a consistent scale helps traders spot overbought/oversold conditions, potential mean reversion setups, and momentum shifts around a moving average.
📦 Features
⚙️ Settings
⚡️ Showcase
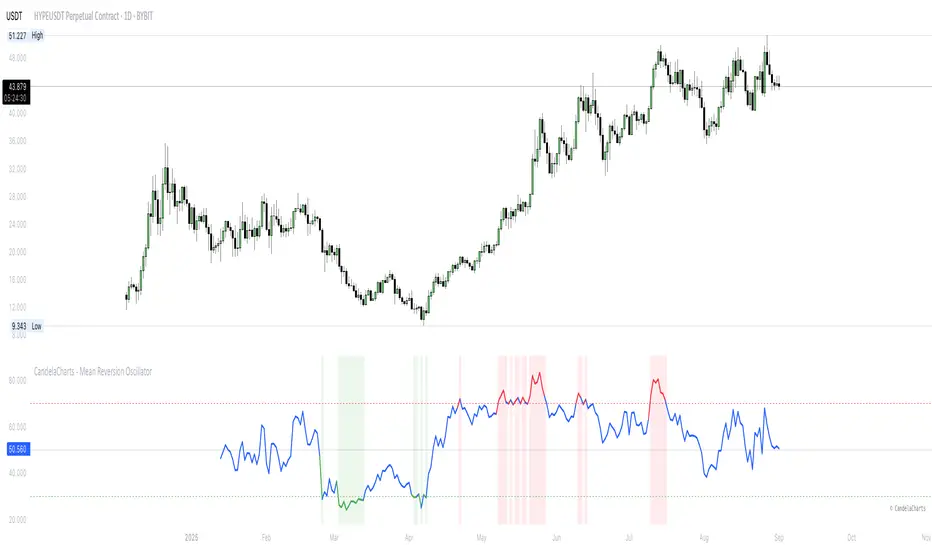
Overbought/Oversold Zones

Divergences

📒 Usage
The Mean Reversion Oscillator (MRO) is best used as a context tool, not as a standalone buy/sell signal generator. Its primary purpose is to tell you when the price is statistically stretched relative to its average, so you can anticipate a potential return toward the mean.
🚨 Alerts
The indicator does not provide any alerts!
⚠️ Disclaimer
These tools are exclusively available on the TradingView platform.
Our charting tools are intended solely for informational and educational purposes and should not be regarded as financial, investment, or trading advice. They are not designed to predict market movements or offer specific recommendations. Users should be aware that past performance is not indicative of future results and should not rely on these tools for financial decisions. By using these charting tools, the purchaser agrees that the seller and creator hold no responsibility for any decisions made based on information provided by the tools. The purchaser assumes full responsibility and liability for any actions taken and their consequences, including potential financial losses or investment outcomes that may result from the use of these products.
By purchasing, the customer acknowledges and accepts that neither the seller nor the creator is liable for any undesired outcomes stemming from the development, sale, or use of these products. Additionally, the purchaser agrees to indemnify the seller from any liability. If invited through the Friends and Family Program, the purchaser understands that any provided discount code applies only to the initial purchase of Candela's subscription. The purchaser is responsible for canceling or requesting cancellation of their subscription if they choose not to continue at the full retail price. In the event the purchaser no longer wishes to use the products, they must unsubscribe from the membership service, if applicable.
We do not offer reimbursements, refunds, or chargebacks. Once these Terms are accepted at the time of purchase, no reimbursements, refunds, or chargebacks will be issued under any circumstances.
By continuing to use these charting tools, the user confirms their understanding and acceptance of these Terms as outlined in this disclaimer.
The Mean Reversion Oscillator (MRO) is a bounded 0–100 indicator that shows how far the price has deviated from its statistical mean. Normalizing deviations into a consistent scale helps traders spot overbought/oversold conditions, potential mean reversion setups, and momentum shifts around a moving average.
📦 Features
- Bounded scale (0–100) for easy recognition of stretched conditions.
- Customizable MA & StdDev periods for different trading horizons.
- Dynamic coloring: Red = Overbought, Green = Oversold, Blue = Neutral
- Visual aids: Background shading in OB/OS zones + 50 midline.
⚙️ Settings
- MA Length – Period for the moving average baseline.
- StdDev Length – Standard deviation window. Tip: match the MA length for smoother results.
- Overbought Level – Threshold for stretched highs.
- Oversold Level – Threshold for stretched lows.
⚡️ Showcase
Overbought/Oversold Zones
Divergences
📒 Usage
The Mean Reversion Oscillator (MRO) is best used as a context tool, not as a standalone buy/sell signal generator. Its primary purpose is to tell you when the price is statistically stretched relative to its average, so you can anticipate a potential return toward the mean.
- Add to chart – Paste the script in TradingView and load it in a separate pane.
- Set MA Length – Use 20–50 for intraday, 100–200 for swing/position trading.
- Match StdDev Length – Keep it close to the MA Length to avoid distortion (e.g., MA 200 → StdDev 200).
- Interpret readings:
>70 (Overbought) – Price stretched high, reversion or slowdown likely.
<30 (Oversold) – Price stretched low, bounce potential.
50 (Midline) – Neutral, momentum shift point. - Use with confluence – Strongest signals occur when MRO extremes align with S/R levels, trend filters, or volume cues.
- Adjust thresholds – 70/30 is balanced; 80/20 gives fewer but stronger signals, 60/40 gives more but weaker ones.
- Stay trend-aware – In strong trends, OB/OS can persist. Always check higher timeframe bias before fading moves.
🚨 Alerts
The indicator does not provide any alerts!
⚠️ Disclaimer
These tools are exclusively available on the TradingView platform.
Our charting tools are intended solely for informational and educational purposes and should not be regarded as financial, investment, or trading advice. They are not designed to predict market movements or offer specific recommendations. Users should be aware that past performance is not indicative of future results and should not rely on these tools for financial decisions. By using these charting tools, the purchaser agrees that the seller and creator hold no responsibility for any decisions made based on information provided by the tools. The purchaser assumes full responsibility and liability for any actions taken and their consequences, including potential financial losses or investment outcomes that may result from the use of these products.
By purchasing, the customer acknowledges and accepts that neither the seller nor the creator is liable for any undesired outcomes stemming from the development, sale, or use of these products. Additionally, the purchaser agrees to indemnify the seller from any liability. If invited through the Friends and Family Program, the purchaser understands that any provided discount code applies only to the initial purchase of Candela's subscription. The purchaser is responsible for canceling or requesting cancellation of their subscription if they choose not to continue at the full retail price. In the event the purchaser no longer wishes to use the products, they must unsubscribe from the membership service, if applicable.
We do not offer reimbursements, refunds, or chargebacks. Once these Terms are accepted at the time of purchase, no reimbursements, refunds, or chargebacks will be issued under any circumstances.
By continuing to use these charting tools, the user confirms their understanding and acceptance of these Terms as outlined in this disclaimer.
版本注释
CandelaCharts - Mean Reversion Oscillator 1.0.1- Better inputs organisation
仅限邀请脚本
只有作者授权的用户才能访问此脚本。您需要申请并获得使用许可。通常情况下,付款后即可获得许可。更多详情,请按照下方作者的说明操作,或直接联系CandelaCharts。
TradingView不建议您付费购买或使用任何脚本,除非您完全信任其作者并了解其工作原理。您也可以在我们的社区脚本找到免费的开源替代方案。
作者的说明
Explore all CandelaCharts indicators at: https://www.candelacharts.com/. Connect with our community on Discord: https://discord.gg/etGSTepqbu. All scripts and content provided by CandelaCharts are intended for informational and educational purposes only.
Get access to our exclusive tools: candelacharts.com
Join our community: discord.gg/etGSTepqbu
All content provided by CandelaCharts is for informational & educational purposes only.
Join our community: discord.gg/etGSTepqbu
All content provided by CandelaCharts is for informational & educational purposes only.
免责声明
这些信息和出版物并非旨在提供,也不构成TradingView提供或认可的任何形式的财务、投资、交易或其他类型的建议或推荐。请阅读使用条款了解更多信息。