OPEN-SOURCE SCRIPT
Dynamic Square Levels
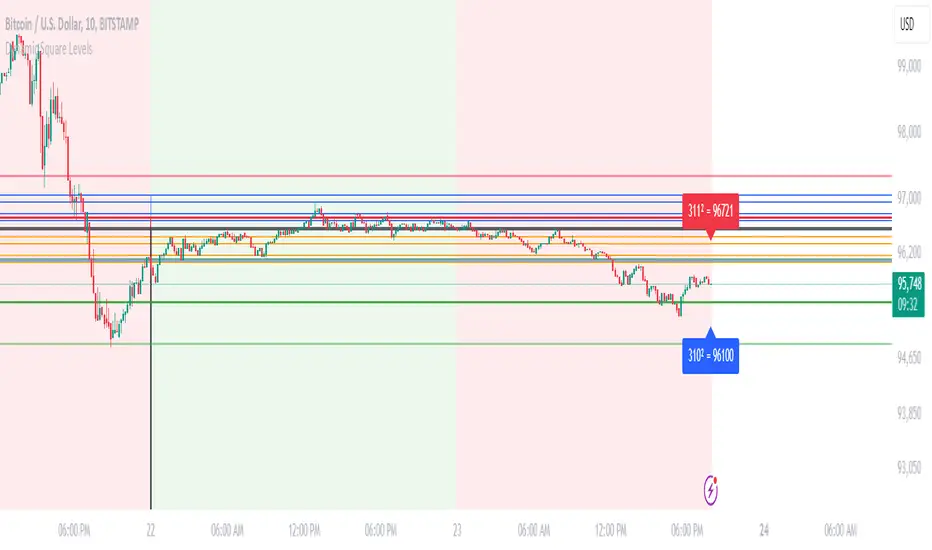
**Dynamic Square Levels with Strict Range Condition**
This script is designed to help traders visualize dynamic price levels based on the square root of the current price. It calculates key levels above and below the current price, providing a clear view of potential support and resistance zones. The script is highly customizable, allowing you to adjust the number of levels, line styles, and label settings to suit your trading strategy.
---
### **Key Features**:
1. **Dynamic Square Levels**:
- Calculates price levels based on the square root of the current price.
- Plots levels above and below the current price for better market context.
2. **Range Condition**:
- Lines are only drawn when the current price is closer to the base level (`square(base_n)`) than to the next level (`square(base_n + 1)`).
- Ensures levels are only visible when they are most relevant.
3. **Customizable Levels**:
- Choose the number of levels to plot (up to 20 levels).
- Toggle additional levels (e.g., 0.25, 0.5, 0.75) for more granular analysis.
4. **Line and Label Customization**:
- Adjust line width, style (solid, dashed, dotted), and extend direction (left, right, both, or none).
- Customize label text, size, and position for better readability.
5. **Background Highlight**:
- Highlights the background when the current price is closer to the base level, providing a visual cue for key price zones.
---
### **How It Works**:
- The script calculates the square root of the current price and uses it to generate dynamic levels.
- Levels are plotted above and below the current price, with customizable spacing.
- Lines and labels are only drawn when the current price is within a specific range, ensuring clean and relevant visuals.
---
### **Why Use This Script?**:
- **Clear Visuals**: Easily identify key support and resistance levels.
- **Customizable**: Tailor the script to your trading style with adjustable settings.
- **Efficient**: Levels are only drawn when relevant, avoiding clutter on your chart.
---
### **Settings**:
1. **Price Type**: Choose the price source (Open, High, Low, Close, HL2, HLC3, HLCC4).
2. **Number of Levels**: Set the number of levels to plot (1 to 20).
3. **Line Style**: Choose between solid, dashed, or dotted lines.
4. **Line Width**: Adjust the thickness of the lines (1 to 5).
5. **Label Settings**: Customize label text, size, and position.
---
### **Perfect For**:
- Traders who rely on dynamic support and resistance levels.
- Those who prefer clean and customizable chart visuals.
- Anyone looking to enhance their price action analysis.
---
**Get started today and take your trading to the next level with Dynamic Square Levels!** 🚀
开源脚本
秉承TradingView的精神,该脚本的作者将其开源,以便交易者可以查看和验证其功能。向作者致敬!您可以免费使用该脚本,但请记住,重新发布代码须遵守我们的网站规则。
免责声明
这些信息和出版物并非旨在提供,也不构成TradingView提供或认可的任何形式的财务、投资、交易或其他类型的建议或推荐。请阅读使用条款了解更多信息。
免责声明
这些信息和出版物并非旨在提供,也不构成TradingView提供或认可的任何形式的财务、投资、交易或其他类型的建议或推荐。请阅读使用条款了解更多信息。