PROTECTED SOURCE SCRIPT
Instant RSI Divergence
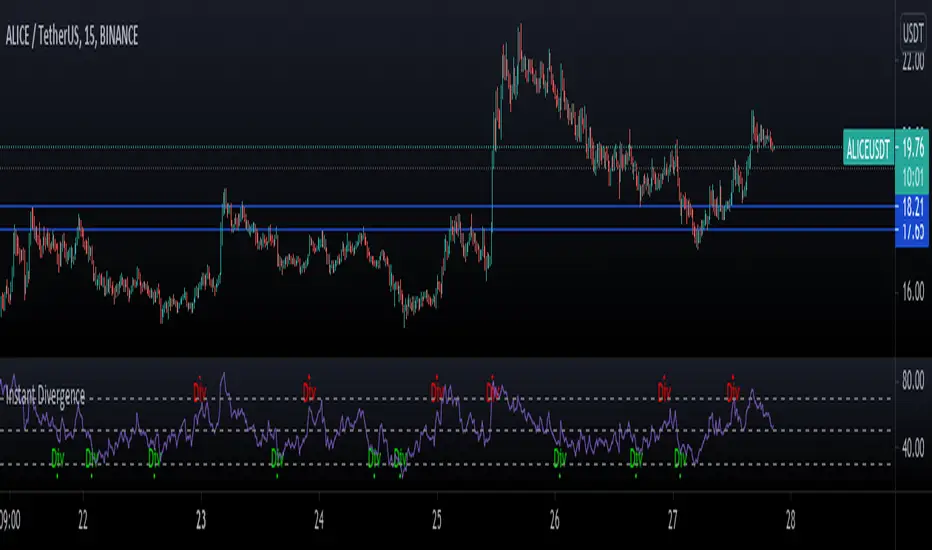
This script uses RSI Highs and Lows along with measuring price actions Highs and lows to find Divergences instantly.
The common problem when doing this is that you end up with signals all over the place if you dont use the pivot finder as confirmation however I have found a way to avoid this problem.
Since there extra bars to confirm whether price are making pivot highs or not, you can end up with some signals which are invalidated a few bars later.
The Green Divs are showing Bullish divergence and the Red Divs are showing bearish divergence.
You can use this with other indicators to mark up more levels of confluence to confirm trade entries.
受保护脚本
此脚本以闭源形式发布。 但是,您可以自由使用,没有任何限制 — 了解更多信息这里。
免责声明
这些信息和出版物并非旨在提供,也不构成TradingView提供或认可的任何形式的财务、投资、交易或其他类型的建议或推荐。请阅读使用条款了解更多信息。
受保护脚本
此脚本以闭源形式发布。 但是,您可以自由使用,没有任何限制 — 了解更多信息这里。
免责声明
这些信息和出版物并非旨在提供,也不构成TradingView提供或认可的任何形式的财务、投资、交易或其他类型的建议或推荐。请阅读使用条款了解更多信息。