OPEN-SOURCE SCRIPT
A.P.E Quarter Pts
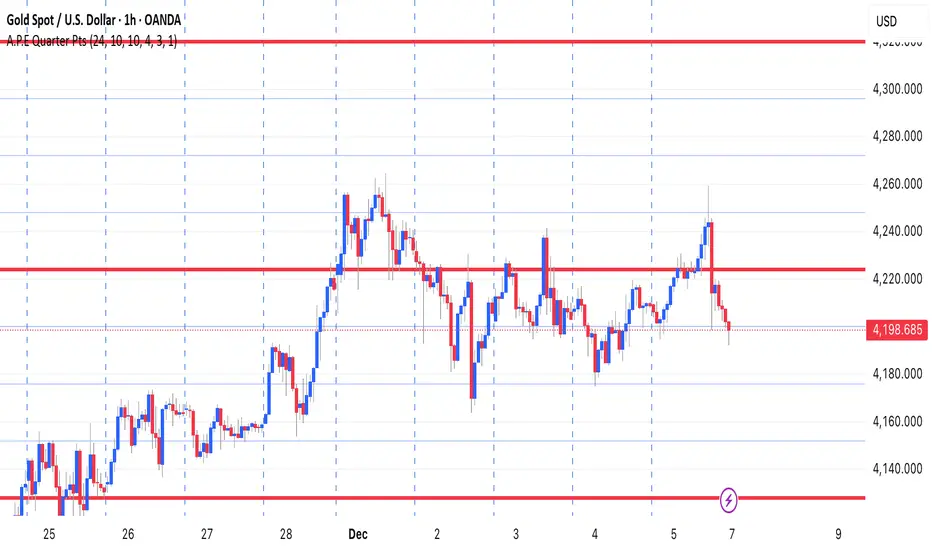
This indicator draws a set of straight horizontal price levels on your chart.
Each line is spaced evenly apart at a distance you choose — these are called quarter-points.
As price moves, the grid of lines stays centered around the current price, so you always see the nearest support and resistance levels. The lines above price show possible resistance, and the lines below price show possible support.
Some of the lines can be drawn thicker or in a stronger color to show more important levels.
Overall, the indicator gives you a clean, easy-to-read structure of evenly spaced levels that help you see where price may react, stall, bounce, or reverse.
开源脚本
秉承TradingView的精神,该脚本的作者将其开源,以便交易者可以查看和验证其功能。向作者致敬!您可以免费使用该脚本,但请记住,重新发布代码须遵守我们的网站规则。
免责声明
这些信息和出版物并非旨在提供,也不构成TradingView提供或认可的任何形式的财务、投资、交易或其他类型的建议或推荐。请阅读使用条款了解更多信息。
开源脚本
秉承TradingView的精神,该脚本的作者将其开源,以便交易者可以查看和验证其功能。向作者致敬!您可以免费使用该脚本,但请记住,重新发布代码须遵守我们的网站规则。
免责声明
这些信息和出版物并非旨在提供,也不构成TradingView提供或认可的任何形式的财务、投资、交易或其他类型的建议或推荐。请阅读使用条款了解更多信息。