OPEN-SOURCE SCRIPT
Opening Range 5 Min Lines
Opening Range Lines Indicator
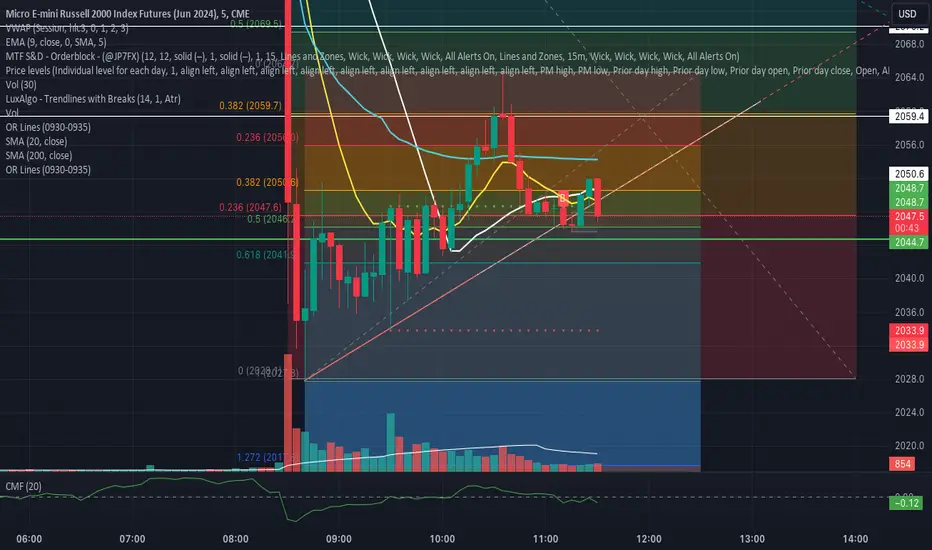
The Opening Range Lines indicator, abbreviated as "OR Lines," is a tool designed to visualize the price range established during the initial moments of a trading session. It helps traders identify significant levels of support and resistance based on the price action during the opening minutes of the session.
Features:
Customizable Timeframe: Traders can specify the duration of the opening range, typically within the first few minutes of the trading session, using the input parameter.
High and Low Lines: The indicator plots two lines on the chart representing the highest and lowest prices reached during the defined opening range period.
Color-Coded Visualization: The opening range high and low lines are color-coded for easy identification. The high line is typically displayed in green, while the low line is displayed in red.
Usage:
Support and Resistance: Traders often use the opening range lines as dynamic support and resistance levels. Prices that breach the opening range high or low may indicate potential breakout or breakdown opportunities.
Intraday Trading: Day traders can utilize the opening range lines to establish intraday trading strategies. For example, buying when the price exceeds the opening range high and selling when it falls below the opening range low.
Confirmation Tool: The opening range lines can also serve as confirmation tools for other technical indicators or trading signals. A bullish signal accompanied by a breakout above the opening range high may reinforce a buy signal, while a bearish signal combined with a breakdown below the opening range low may strengthen a sell signal.
Notes:
Extended Hours Trading: To accurately display the opening range lines for stocks or ETFs, users should enable extended hours trading on their chart settings.
Customization: Traders can adjust the timeframe and appearance settings of the indicator to suit their specific trading preferences and market conditions.
The Opening Range Lines indicator provides traders with valuable insights into the early price dynamics of a trading session, aiding in decision-making and trade management during intraday trading activities.
开源脚本
秉承TradingView的精神,该脚本的作者将其开源,以便交易者可以查看和验证其功能。向作者致敬!您可以免费使用该脚本,但请记住,重新发布代码须遵守我们的网站规则。
免责声明
这些信息和出版物并非旨在提供,也不构成TradingView提供或认可的任何形式的财务、投资、交易或其他类型的建议或推荐。请阅读使用条款了解更多信息。
开源脚本
秉承TradingView的精神,该脚本的作者将其开源,以便交易者可以查看和验证其功能。向作者致敬!您可以免费使用该脚本,但请记住,重新发布代码须遵守我们的网站规则。
免责声明
这些信息和出版物并非旨在提供,也不构成TradingView提供或认可的任何形式的财务、投资、交易或其他类型的建议或推荐。请阅读使用条款了解更多信息。